
Page 283 - Phase-Locked Loops Design, Simulation, and Applications
P. 283
MIXED-SIGNAL PLL APPLICATIONS PART 2: FRACTIONAL-N FREQUENCY
SYNTHESIZERS Ronald E. Best 168
of bits of the ADC. Using Eq. (7.1), we can now build a mathematical model of the one-bit
ADC (see Fig. 7.5c). The one-bit converter is replaced here by a summing block representing
Eq. (7.1). Assume for the moment that the input signal is constant,—for example, U = 0.7.
A
What will the error sequence be in this case? The answer is trivial: Each quantized output
sample has the value 1, and each quantization error becomes 1 − 0.7 = 0.3. Processing the
error doesn’t bring any benefit, unless we manipulate the signal applied to the quantizer in
such a way that the error sequence becomes non trivial, or, in other words, becomes a
randomized sequence. Obviously, we must add at least two function blocks to the ADC—thus,
a preprocessing block F and a postprocessing block G, as shown in Fig. 7.5d. This is the
simplest oversampling ADC configuration, but be aware that it’s not a ΣΔ ADC. How will
these two blocks look?
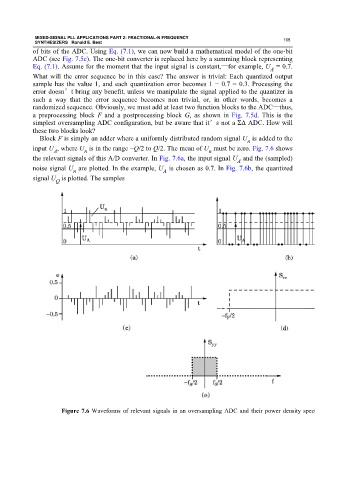
Block F is simply an adder where a uniformly distributed random signal U is added to the
n
input U , where U is in the range −Q/2 to Q/2. The mean of U must be zero. Fig. 7.6 shows
n
n
A
the relevant signals of this A/D converter. In Fig. 7.6a, the input signal U and the (sampled)
A
noise signal U are plotted. In the example, U is chosen as 0.7. In Fig. 7.6b, the quantized
n
A
signal U is plotted. The samples
Q
Figure 7.6 Waveforms of relevant signals in an oversampling ADC and their power density spect