
Page 157 - Photoreactive Organic Thin Films
P. 157
936 ZOUHEIR SEKKAT AND WOLFGANG KNOLL
0.75
on on
0.70
0.65
0.60
5
) p=1000-10 Pa @ 0=54.27°
0) 0.55 s
4= _ T_ p= 760-10 Pa @ 0=53.96°
CD
5
p= 520-10 Pa <g ©=53.65°
5
0.50 -*- p= 260-10 Pa @ 0*53.35°
5
_._p= 40-10 Pa@e=53.05°
0.45
Off
100 200 300 400 500 600
t/sec
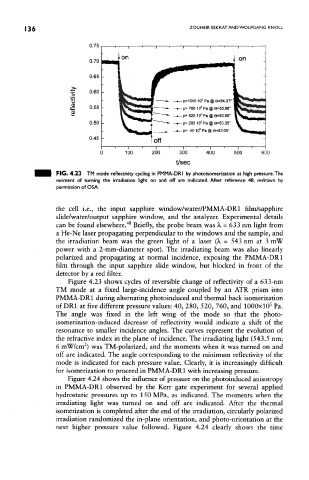
FIG. 4.23 TM mode reflectivity cycling in PMMA-DRI by photoisomerization at high pressure. The
moment of turning the irradiation light on and off are indicated. After reference 48, redrawn by
permission of OSA.
the cell i.e., the input sapphire window/water/PMMA-DRl film/sapphire
slide/water/output sapphire window, and the analyzer. Experimental details
48
can be found elsewhere. Briefly, the probe beam was A, = 633 nm light from
a He-Ne laser propagating perpendicular to the windows and the sample, and
the irradiation beam was the green light of a laser (X = 543 nm at 3 mW
power with a 2-mm-diameter spot). The irradiating beam was also linearly
polarized and propagating at normal incidence, exposing the PMMA-DRI
film through the input sapphire slide window, but blocked in front of the
detector by a red filter.
Figure 4.23 shows cycles of reversible change of reflectivity of a 633-nm
TM mode at a fixed large-incidence angle coupled by an ATR prism into
PMMA-DRI during alternating photoinduced and thermal back isomerization
5
of DR1 at five different pressure values: 40, 280, 520, 760, and lOOOxlO Pa.
The angle was fixed in the left wing of the mode so that the photo-
isomerization-induced decrease of reflectivity would indicate a shift of the
resonance to smaller incidence angles. The curves represent the evolution of
the refractive index in the plane of incidence. The irradiating light (543.5 nm;
2
6 mW/crn ) was TM-polarized, and the moments when it was turned on and
off are indicated. The angle corresponding to the minimum reflectivity of the
mode is indicated for each pressure value. Clearly, it is increasingly difficult
for isomerization to proceed in PMMA-DRI with increasing pressure.
Figure 4.24 shows the influence of pressure on the photoinduced anisotropy
in PMMA-DRI observed by the Kerr gate experiment for several applied
hydrostatic pressures up to 150 MPa, as indicated. The moments when the
irradiating light was turned on and off are indicated. After the thermal
isomerization is completed after the end of the irradiation, circularly polarized
irradiation randomized the in-plane orientation, and photo-orientation at the
next higher pressure value followed. Figure 4.24 clearly shows the time