
Page 77 - Pipeline Risk Management Manual Ideas, Techniques, and Resources
P. 77
3/56 Third-party Damage Index
along and either side of the ROW. The opportunity for early
discovery lies in the ability to detect activities before the
pipeline ROW is encroached. Frequency distribution
Note also the ability of certain aircraft (helicopters) to take urve based on recent
immediate action to interrupt a potentially dangerous activity. historical data
Such interruptions include landing the aircraft or dropping a 6
C
container containing a message in order to alert the third party. tn
3
The suggested point schedule will award points based on 0-
2
patrol frequency under the assumption of optimum effectiveness. LL
Ifthe evaluatorjudges the effectiveness to be less than optimum,
he can reduce the points to the equivalent of a lower patrol fre-
quency. This is reasonable because lower frequency and lower
effectiveness both reduce the area of opportunity for detection.
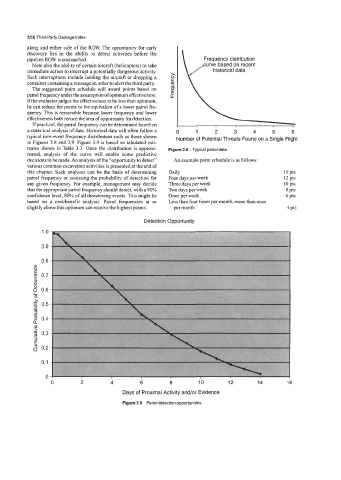
If practical, the patrol frequency can be determined based on
a statistical analysis of data. Historical data will often follow a 0 1 2 3 4 5 6
typical rare-event frequency distribution such as those shown Number of Potential Threats Found on a Single Flight
in Figures 3.8 and 3.9. Figure 3.9 is based on tabulated esti-
mates shown in Table 3.3. Once the distribution is approxi- Figure 3.8 Typical patrol data.
mated, analysis of the curve will enable some predictive
decisions to be made. An analysis of the “opportunity to detect” An example point schedule is as follows:
various common excavation activities is presented at the end of
this chapter. Such analyses can be the basis of determining Daily 15 pts
patrol frequency or assessing the probability of detection for Four days per week 12 pts
any given frequency. For example, management may decide Three days per week IO pts
that the appropriate patrol frequency should detect, with a 90% Two days per week 8 pts
confidence level, 80% of all threatening events. This might be Once per week 6 pts
based on a costhenefit analysis. Patrol frequencies at or Less than four times per month; more than once
slightly above this optimum can receive the highest points. per month 4 pts
Detection Opportunity
1 .o
0.9
0.8
8
c
0.7
L
0
3
6 0.6
c
0
0.5
n
a
n
a 0.4
>
.-
0)
;ri 0.3
-
E’
5 0.2
0.1
0
0 2 4 6 8 10 12 14 16
Days of Proximal Activity and/or Evidence
Figure 3.9 Patrol detection opportunities.