
Page 80 - Pipeline Risk Management Manual Ideas, Techniques, and Resources
P. 80
Third-party damage mitigation analysis 3/59
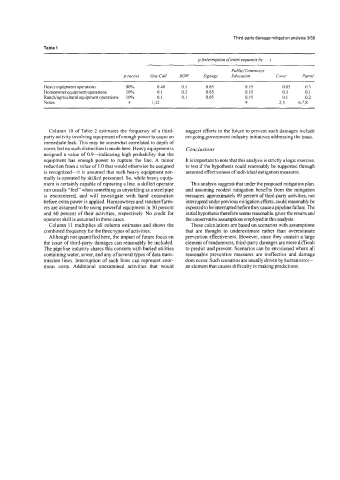
Table 1
p (interruption of event sequence by. . . )
Public/Contractor
p (activ) One Call ROW Signage Education Cover Patrol
Heavy equipment operations 80% 0.48 0.1 0.05 0.15 0.05 0.3
Homeowner equipment operations 1 0% 0.1 0.1 0.05 0.15 0.3 0.1
Ranchlagricultural equipment operations 10% 0. I 0.1 0.05 0.15 0. I 0.2
Notes 4 1.12 9 2.3 6.7.8
Column 10 of Table 2 estimates the frequency of a third- suggest efforts in the future to prevent such damages include
party activity involving equipment ofenough power to cause an on-going government industry initiatives addressing the issue.
immediate leak. This may be somewhat correlated to depth of
cover, but no such distinction is made here. Heavy equipment is Conclusions
assigned a value of 0.9-indicating hgh probability that the
equipment has enough power to rupture the line. A minor It is important to note that this analysis is strictly a logic exercise,
reduction from a value of 1 .O that would otherwise be assigned to test if the hypothesis could reasonably be supported through
is recognized-it is assumed that such heavy equipment nor- assumed effectiveness of individual mitigation measures.
mally is operated by skilled personnel. So, while heavy equip-
ment is certainly capable of rupturing a line, a skilled operator Th~s analysis suggests that under the proposed mitigation plan,
can usually “feel” when something as unyielding as a steel pipe and assuming modest mitigation benefits from the mitigation
is encountered, and will investigate with hand excavation measures, approximately 89 percent of hrd-party activities, not
before extra power is applied. Homeowners and ranchdfarm- interrupted under previous mitigation efforts, could reasonably be
ers are assumed to be using powerful equipment in 30 percent expected to be interrupted before they cause a pipeline failure. The
and 60 percent of their activities, respectively. No credit for initial hypothesis therefore seems reasonable, given the results and
operator skill is assumed in these cases. the conservative assumptions employed in this analysis.
Column 11 multiplies all column estimates and shows the These calculations are based on scenarios with assumptions
combined frequency for the three types of activities. that are thought to underestimate rather than overestimate
Although not quantified here, the impact of future focus on prevention effectiveness. However, since they contain a large
the issue of third-party damages can reasonably be included. element of randomness, third-party damages are more difficult
The pipeline industry shares this concern with buried utilities to predict and prevent. Scenarios can be envisioned where all
containing water, sewer, and any of several types of data trans- reasonable preventive measures are ineffective and damage
mission lines. Interruption of such lines can represent enor- does occur. Such scenarios are usually dnven by human error-
mous costs. Additional unexamined activities that would an element that causes difficulty in making predictions.