
Page 78 - Pipeline Risk Management Manual Ideas, Techniques, and Resources
P. 78
Third-party damage mitigation analysis 3/57
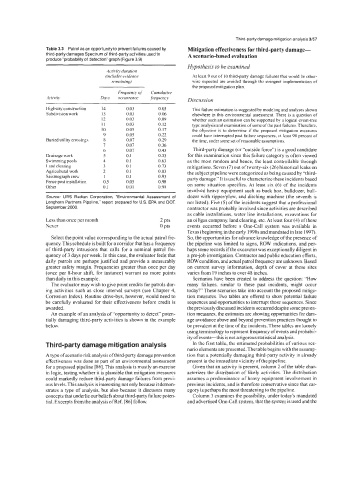
Table 3.3 Patrol as an opportunity to prevent failures caused by Mitigation effectiveness for third-party damage-
third-party damages Spectrum of third-party activities used to A scenario-based evaluation
produce “probability of detection” graph (Figure 3.9)
Hypothesis to be examined
Activity duration
(includes evidence At least 9 out of 10 third-party damage failures that would be other-
remaining) wise expected are avoided through the stringent implementation of
the proposed mitigation plan.
Frequencvof Cumulative
4ctiviry Davs occurrence frequency Discussion
Highway construction 14 0.03 0.03 This failure estimation is suggested by modeling and analyses shown
Subdivision work 13 0.03 0.06 elsewhere in this environmental assessment, There is a question of
12 0.03 0.09 whether such an estimation can be supported by a logical event-tree
It 0.03 0.12 type analysis and examination of some ofthe past failures. Therefore,
10 0.05 0.17 the objective is to determine if the proposed mitigation measures
9 0.05 0.22 could have interrupted past failure sequences, at least 90 percent of
Buried utility crossings 8 0.07 0.29 the time, under some set ofreasonable assumptions.
7 0.07 0.36
6 0.07 0.43 Third-party damage (or “outside force”) is a good candidate
Drainage work 5 0.1 OS3 for this examination since this failure category is often viewed
Swimming pools 4 0.1 0.63 as the most random and hence, the least controllable through
Land clearing 3 0.1 0.73 mitigations. Seven (7) out oftwenty-six (26) historical leaks on
Agricultural work 2 0.1 0.83 the subject pipeline were categorized as being caused by “third-
Seismograph crew 1 0.1 0.93 party damage.” It is useful to characterize these incidents based
Fence post installation 0.5 0.05 0.98
Other 0. I 0.01 0.99 on some situation specifics. At least six (6) of the incidents
involved heavy equipment such as back hoe, bulldozer. bull-
Source URS Radian Corporation, ‘“Environmental Assessment of dozer with ripperiplow, and ditching machine (the seventh is
Longhorn Partners Pipeline.” report prepared for US EPA and DOT, not listed). Five (5) of the incidents suggest that a professional
September 2000 contractor was probably involved since activities are described
as cable installations, water line installations, excavations for
Less than once per month 2 pts an oil/gas company, land clearing, etc. At least four (4) of these
Never 0 pts events occurred before a One-Call system was available in
Texas (beginning in the early 1990s and mandated in late 1997).
Select the point value corresponding to the actual patrol fre- So, the opportunities for advance knowledge of the presence of
quency. This schedule is built for a corridor that has a frequency the pipeline was limited to signs, ROW indications, and per-
of third-party intrusions that calls for a nominal patrol fre- haps some records ifthe excavator was exceptionally diligent in
quency of 3 days per week. In this case, the evaluator feels that a pre-job investigation. Contractor and public education efforts,
daily patrols are perhaps justified and provide a measurably ROW condition, and actual patrol frequency are unknown. Based
greater safety margin. Frequencies greater than once per day on current survey information, depth of cover at these sites
(once per 8-hour shift, for instance) warrant no more points varies from 19 inches to over 48 inches.
than daily in this example. Scenarios have been created to address the question: “How
The evaluator may wish to give point credits for patrols dnr- many failures, similar to these past incidents, might occur
ing activities such as close interval surveys (see Chapter 4, today?” These scenarios take into account the proposed mitiga-
Corrosion Index). Routine drive-bys, however, would need to tion measures. Two tables are offered to show potential failure
be carefully evaluated for their effectiveness before credit is sequences and opportunities to interrupt those sequences. Since
awarded. the previously discussed incidents occurred despite some preven-
An example of an analysis of “opportunity to detect” poten- tion measures, the estimates are showing opportunities for dam-
tially damaging third-party actikities is shown in the example age avoidance above and beyond prevention practices thought to
below. be prevalent at the time of the incidents. These tables are loosely
using terminology to represent frequency of events and probabil-
ity of events-this is not a rigorous statistical analysis.
Third-party damage mitigation analysis In the first table, the estimated probabilities of various sce-
nario elements are presented. The table begins with the assump-
A type of scenario risk analysis of third-party damage prevention tion that a potentially damaging third-party activity is already
effectiveness was done as part of an environmental assessment present in the immediate vicinity ofthe pipeline.
for a proposed pipeline [86]. This analysis is mostly an exercise Given that an activity is present, column 2 of the table char-
in logic, testing whether it is plausible that mitigation measures acterizes the distribution of likely activities. The distribution
could markedly reduce third-party damage failures from previ- assumes a predominance of heavy equipment involvement in
ous levels. This analysis is interesting not only because it demon- previous incidents, and is therefore conservative since that cat-
strates a type of analysis, but also because it discusses many egory is perhaps the most threatening to the pipeline.
concepts that underlie our beliefs about third-party failure poten- Column 3 examines the possibility, under today’s mandated
tial. Excerpts from the analysis ofRef. [86] follow. and advertised One-Call system. that the system is used and the