
Page 215 - Practical Control Engineering a Guide for Engineers, Managers, and Practitioners
P. 215
Distributed Processes 189
1~~~~~~~~~~~~~~~~
:::i
0 0 0 ••
r t r r r r a• 1 1 a• s•s :·:·: i• .... : i -~ ": ": 1 : : : 1
I :I: •I
.... : .. ::::::::
0
-20
- -40
~
cu
~ --60
f -80 ••••• 0 o • o ,• o : o oool •
0,
,• 0
:
-100 ... ; . : . ·. : ~ <: :- .
-120~--~~~--~~~~--~~--~--~~~~
to-2 1o- 1 1~ 10 1 to2
Frequency (Hz)
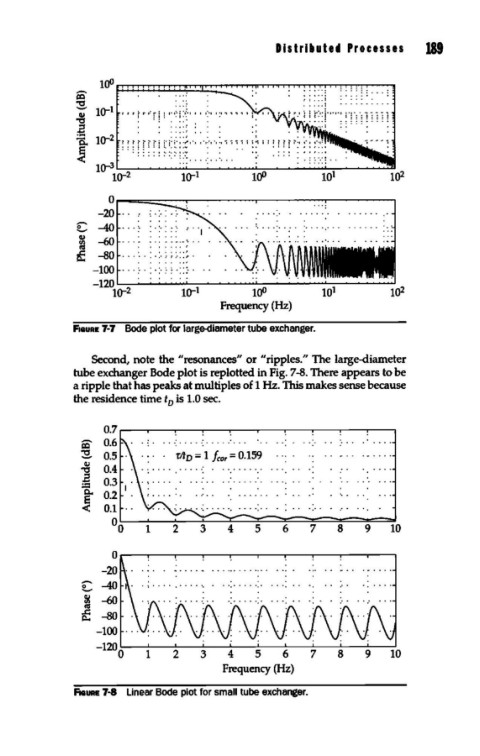
FIGURE 7-7 Bode plot for large-diameter tube exchanger.
Second, note the "resonances" or "ripples." The large-diameter
tube exchanger Bode plot is replotted in Fig. 7-8. There appears to be
a ripple that has peaks at multiples of 1 Hz. This makes sense because
the residence time t is 1.0 sec.
0
0.7
~ 0.6 .. : .... : . .... · ... . . . . . . ...
~ 0.5 rlto = 1 /cor= 0.159
., 0.4 . . . . . . . . . . . .. . ...
cu
2 . . . . . . . . . . . . . . . .. . . . . ...
:.= 0.3
a..
e 0.2
< 0.1 ·.·.
00 1 2 3 4 5 6 7 8 9 10
0
-20 .............
- -40 • 0 •••• . . . . ·. . ·.· ... ·.· • 0 •• .. . ·. ....
~
~ --60
cu
..c
rl.. -80
-100
-120
0 1 2 3 4 5 6 7 8 9 10
Frequency (Hz)
FIGURE 7-8 Linear Bode plot for small tube exchanger.