
Page 217 - Practical Control Engineering a Guide for Engineers, Managers, and Practitioners
P. 217
Distributed Processes 191
Consequently, the outlet liquid will be slightly higher in temperature,
as indicated by the local peak in the magnitude curve at about f = t.5 Hz
in Fig. 7-8. This argument can be continued to explain the other peaks
and valleys as the frequency changes.
Also, note that the maximum amplitude at low frequencies is not
unity but 0.6321 which was the maximum outlet temperature for the
step-change response. This is because the tube is too short for the
outlet temperature to reach full value no matter how low the steam
jacket frequency. Even with these relatively strange phenomena, the
phase lag never exceeds 110° and bounces around 90°.
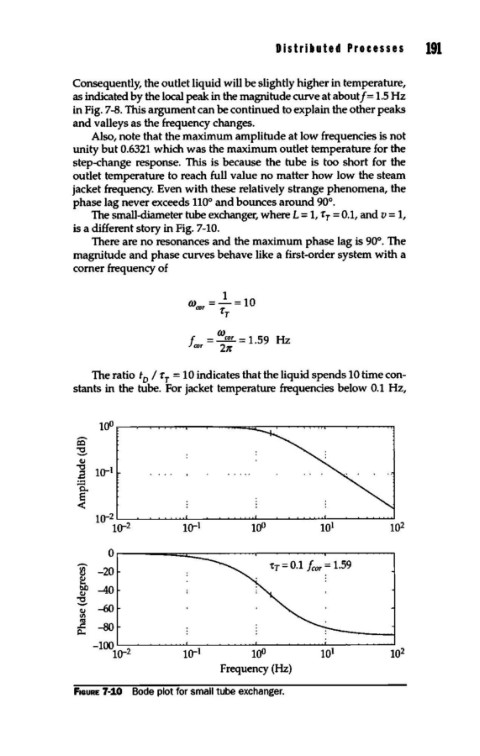
The small-diameter tube exchanger, where L = 1, rr = 0.1, and v = 1,
is a different story in Fig. 7-10.
There are no resonances and the maximum phase lag is 90°. The
magnitude and phase curves behave like a first-order system with a
corner frequency of
1
(J) =-=10
ror fr
(J)
f. = ~= 1.59 Hz
ror 21r
The ratio t I rr = 10 indicates that the liquid spends 10 time con-
0
stants in the tube. For jacket temperature frequencies below 0.1 Hz,
to 0
6'
~
Q.l
"'0
.a 1o-1
:.::1
0..
e
<
1o-2
1o-2 1o-1 to 0 101 102
0
tT = 0.1 /cor= 1.59
~ -20
~
bO -40
Q.l
~
Q.l -60
(/)
~
..c -80
Q...
-100
1o-2 1o-1 100 101 10 2
Frequency (Hz)
FIGURE 7-10 Bode plot for small tube exchanger.