
Page 216 - Practical Control Engineering a Guide for Engineers, Managers, and Practitioners
P. 216
190 Chapter Seven
0.8
5'
:2. 0.6
cu
"'0
.a 0.4
:.:1
a..
~
1 2 3 4 5 6 7 8 9 10
0
-20 .. . . ... .
- -40 ·I
~
~ -60
!IS
..c
rl.. -80
-100
-120
0 1 2 3 4 5 6 7 8 9 10
Frequency (Hz)
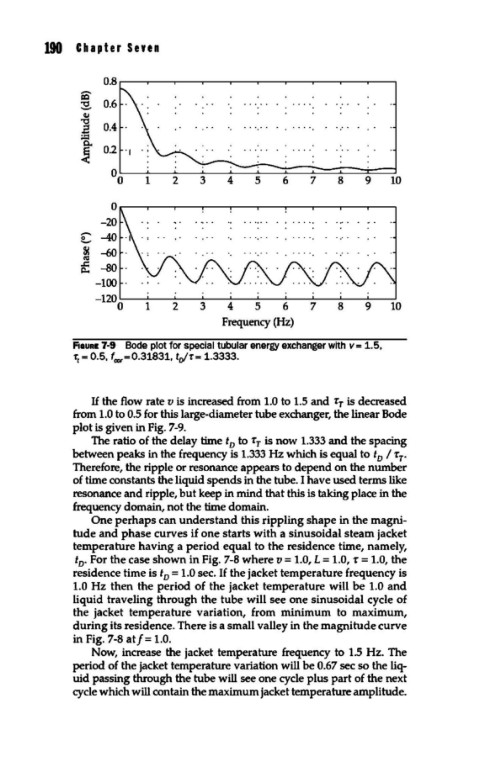
fiGURE 7-9 Bode plot for special tubular energy exchanger with v = 1.5,
rt = 0.5, fcor=0.31831, tofr= 1.3333.
If the flow rate v is increased from 1.0 to 1.5 and r 1 is decreased
from 1.0 to 0.5 for this large-diameter tube exchanger, the linear Bode
plot is given in Fig. 7-9.
The ratio of the delay time t to T 1 is now 1.333 and the spacing
0
between peaks in the frequency is 1.333 Hz which is equal to t I -r .
0 1
Therefore, the ripple or resonance appears to depend on the number
of time constants the liquid spends in the tube. I have used terms like
resonance and ripple, but keep in mind that this is taking place in the
frequency domain, not the time domain.
One perhaps can understand this rippling shape in the magni-
tude and phase curves if one starts with a sinusoidal steam jacket
temperature having a period equal to the residence time, namely,
t • For the case shown in Fig. 7-8 where v = 1.0, L = 1.0, 'r = 1.0, the
0
residence time is t = 1.0 sec. If the jacket temperature frequency is
0
1.0 Hz then the period of the jacket temperature will be 1.0 and
liquid traveling through the tube will see one sinusoidal cycle of
the jacket temperature variation, from minimum to maximum,
during its residence. There is a small valley in the magnitude curve
in Fig. 7-8 atf= 1.0.
Now, increase the jacket temperature frequency to 1.5 Hz. The
period of the jacket temperature variation will be 0.67 sec so the liq-
uid passing through the tube will see one cycle plus part of the next
cycle which will contain the maximum jacket temperature amplitude.