
Page 146 - Process Equipment and Plant Design Principles and Practices by Subhabrata Ray Gargi Das
P. 146
5.10 Design illustration 143
Solution (A)
It is assumed that the heat exchangers involved are shell and tube type with counter-current flow
(F T ¼ 1) and DT min is adopted as 20 C based on the information in Table 5.2 for chemical industry.
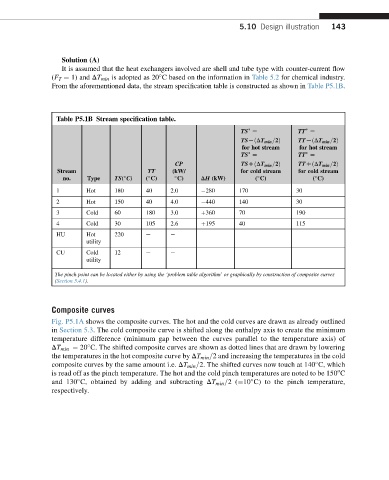
From the aforementioned data, the stream specification table is constructed as shown in Table P5.1B.
Table P5.1B Stream specification table.
TS [ TT [
TSLðDT min =2Þ TTLðDT min =2Þ
for hot stream for hot stream
TS [ TT [
CP TSDðDT min =2Þ TTDðDT min =2Þ
Stream TT (kW/ for cold stream for cold stream
no. Type TS( C) ( C) C) DH (kW) ( C) ( C)
1 Hot 180 40 2.0 280 170 30
2 Hot 150 40 4.0 440 140 30
3 Cold 60 180 3.0 þ360 70 190
4 Cold 30 105 2.6 þ195 40 115
HU Hot 220 e e
utility
CU Cold 12 e e
utility
The pinch point can be located either by using the ‘problem table algorithm’ or graphically by construction of composite curves
(Section 5.4.1).
Composite curves
Fig. P5.1A shows the composite curves. The hot and the cold curves are drawn as already outlined
in Section 5.3. The cold composite curve is shifted along the enthalpy axis to create the minimum
temperature difference (minimum gap between the curves parallel to the temperature axis) of
DT min ¼ 20 C. The shifted composite curves are shown as dotted lines that are drawn by lowering
the temperatures in the hot composite curve by DT min =2 and increasing the temperatures in the cold
composite curves by the same amount i.e. DT min =2. The shifted curves now touch at 140 C, which
o
is read off as the pinch temperature. The hot and the cold pinch temperatures are noted to be 150 C
and 130 C, obtained by adding and subtracting DT min =2(¼10 C) to the pinch temperature,
respectively.