Page 148 - Process Equipment and Plant Design Principles and Practices by Subhabrata Ray Gargi Das
P. 148

5.10 Design illustration  145


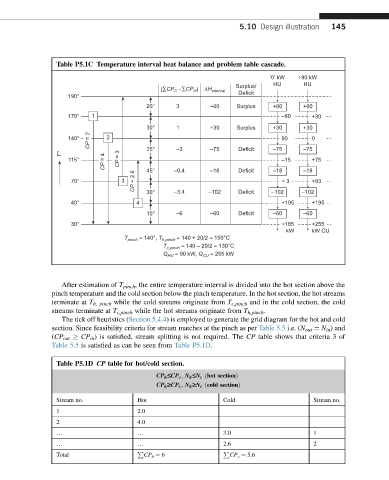
                 Table P5.1C Temperature interval heat balance and problem table cascade.
                                                                            ‘0’ kW  +90 kW
                                                                             HU      HU
                                                                  Surplus/
                                              (∑CP C –∑CP H )  ∆H interval
                                                                   Deficit
                    190°
                                          20°     3        +60     Surplus   +60     +60
                    170°  1                                                    –60     +30
                                          30°     1        +30     Surplus   +30     +30
                          CP = 2
                    140°       2                                               90      0
                  T *                     25°     –3       –75     Deficit   –75     –75
                    115°      CP = 4  CP = 3  45°  –0.4    –18     Deficit   –18 –15  –18 +75


                     70°           3  CP = 2.6   –3.4      –102    Deficit  –102 + 3  –102 +93


                     40°               4  30°                                  +105    +195
                                          10°     –6       –60     Deficit   –60     –60
                     30°                                                       +165    +255
                                                                                  kW   kW CU
                                   T pinch  = 140°, T h,pinch  = 140 + 20/2 = 150°C
                                              T c,pinch  = 140 – 20/2 = 130°C
                                              Q HU  = 90 kW, Q CU  = 255 kW


                  After estimation of T pinch , the entire temperature interval is divided into the hot section above the
               pinch temperature and the cold section below the pinch temperature. In the hot section, the hot streams
               terminate at T h, pinch while the cold streams originate from T c,pinch and in the cold section, the cold
               streams terminate at T c,pinch while the hot streams originate from T h,pinch .
                  The tick off heuristics (Section 5.4.4) is employed to generate the grid diagram for the hot and cold
               section. Since feasibility criteria for stream matches at the pinch as per Table 5.5 i.e. (N out ¼ N in ) and
               (CP out   CP in ) is satisfied, stream splitting is not required. The CP table shows that criteria 3 of
               Table 5.5 is satisfied as can be seen from Table P5.1D.

                 Table P5.1D CP table for hot/cold section.

                                            CP h £CP c ; N h £N c ðhot sectionÞ
                                            CP h ‡CP c ; N h ‡N c ðcold sectionÞ
                 Stream no.            Hot                     Cold                     Stream no.
                 1                     2.0
                 2                     4.0
                 .                     .                       3.0                      1
                 .                     .                       2.6                      2
                                       P                       P
                 Total                   CP h ¼ 6                CP c ¼ 5.6
   143   144   145   146   147   148   149   150   151   152   153