
Page 107 - Radar Technology Encyclopedia
P. 107
CORRELATION function CORRELATION function 97
CORRELATION function. The correlation function is the interference. But filter response is a correlation function of
average value of the product of two functions, x(q), for two the signal. If the normalized voltage at output of the matched
i
different values of the arguments filter is described by the correlation function k(t), then at the
output of the detector, located after the filter, it is determined
K ( q q ) á x q ( )x q ( )ñ
=
,
by the absolute value of the complex envelope of the correla-
x 1 x 2 1 2 1 1 2 2
where <y> represents the statistical average of y. In radar tion function |K(t)|. In this way it allows one to determine
applications the concept of the correlation function is typi- measurement accuracy of useful parameters of signals. AIL
cally applied to random processes, x(t), describing radar, sig- Ref.: DiFranco (1968), p. 111; Varakin (1970), pp. 47–72.
nals s (t) as functions of time:
i
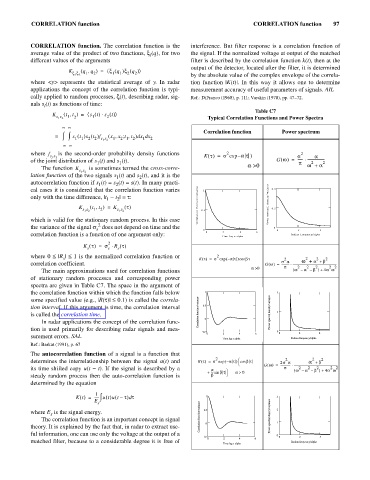
Table C7
=
K ( t t , ) á s t ()s t ()× ñ
s 1 s 2 1 2 1 2 Typical Correlation Functions and Power Spectra
¥ ¥
Correlation function Power spectrum
;
= ò ò s t () s t () f s 1 s 2 ( x x t t ,, 2 1 2 ) x d d x 2
1
2 2
1
1
1
– ¥ – ¥
where f is the second-order probability density functions 2 2
s 1 s 2 K t() = s exp – at ) s a
×
=
of the joint distribution of s (t) and s (t). G w() ------ ------------------- 2
1
1
p
2
The function K is sometimes termed the cross-corre- a >0 w + a
s 1 s 2
lation function of the two signals s (t) and s (t), and it is the
1
2
autocorrelation function if s (t) = s (t) = s(t). In many practi-
2
1
cal cases it is considered that the correlation function varies 1 0.4
only with the time difference, |t - t | = t:
1
2
t
K ( t t , ) K () Correlation function/variance Power spectral density/variance 0.2
=
s 1 s 2 1 2 s 1 s 2 0.5
which is valid for the stationary random process. In this case
2
the variance of the signal s does not depend on time and the 0 0 0 2 4
s
4
2
correlation function is a function of one argument only: 0 Time lag x alpha 6 Radian frequency/alpha
2
K t() = s R t()
×
s s s
where 0 £ | £ 1 is the normalized correlation function or K t() = 2 s exp – ( at ) cos bt 2 2 2 2
|R
s
w +
s a
b
a +
correlation coefficient. G w() ----------- --------------------------------------------------------------
×
=
2 2
2
a >0 p ( 2 2 b ) 4a w
The main approximations used for correlation functions w – a – +
of stationary random processes and corresponding power
spectra are given in Table C7. The space in the argument of
the correlation function within which the function falls below 1 2
some specified value (e.g., |R(t)| £ 0.1) is called the correla-
tion interval. If this argument is time, the correlation interval 0.5
is called the correlation time. Correlation function/variance Power spectral density/variance 1
In radar applications the concept of the correlation func- 0
tion is used primarily for describing radar signals and mea-
0.5 0 2 4 6 0 0 2 4
surement errors. SAL
Time lag x alpha Radian frequency/alpha
Ref.: Barkat (1991), p. 67
The autocorrelation function of a signal is a function that
2
æ
determines the interrelationship between the signal u(t) and K t() = 2 s exp – ( at ) cos b t 2 a + b 2
2s a
è G w() -------------- --------------------------------------------------------------
×
=
2 2
2
2
its time shifted copy u(t - t). If the signal is described by a a ö p ( w – a – b ) 4a w
2
+
>
+ --- sin bt a 0
steady random process then the auto-correlation function is b ø
determined by the equation
1
ò
d
Kt () ----- ut () ut – t ) t 1 3
(
=
E
s
where E is the signal energy. 0.5 Power spectral density/variance 2
s
The correlation function is an important concept in signal Correlation function/variance 1
theory. It is explained by the fact that, in radar to extract use- 0
ful information, one can use only the voltage at the output of a 0
0.5 0 2 4 6 0 2 4
matched filter, because to a considerable degree it is free of Radian frequency/alpha
Time lag x alpha