
Page 65 - Science at the nanoscale
P. 65
9:2
June 9, 2009
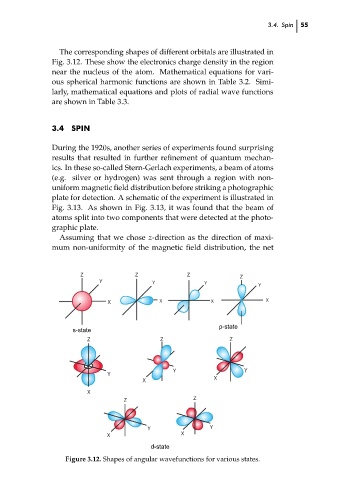
The corresponding shapes of different orbitals are illustrated in
Fig. 3.12. These show the electronics charge density in the region
near the nucleus of the atom. Mathematical equations for vari-
ous spherical harmonic functions are shown in Table 3.2. Simi-
larly, mathematical equations and plots of radial wave functions
are shown in Table 3.3.
SPIN
3.4
During the 1920s, another series of experiments found surprising
results that resulted in further refinement of quantum mechan-
ics. In these so-called Stern-Gerlach experiments, a beam of atoms
(e.g. silver or hydrogen) was sent through a region with non-
uniform magnetic field distribution before striking a photographic
plate for detection. A schematic of the experiment is illustrated in
Fig. 3.13. As shown in Fig. 3.13, it was found that the beam of
atoms split into two components that were detected at the photo-
graphic plate.
Assuming that we chose z-direction as the direction of maxi-
mum non-uniformity of the magnetic field distribution, the net
Z
Z
Y
Y
X
X
p-state
s-state
Z Y X Z RPS: PSP0007 - Science-at-Nanoscale Z Y X 3.4. Spin 55 ch03
Z
Z
Y Y
Y
X X
X
Z
Z
Y Y
X
X
d-state
Figure 3.12. Shapes of angular wavefunctions for various states.