
Page 228 - Semiconductor Manufacturing Handbook
P. 228
Geng(SMH)_CH15.qxd 04/04/2005 19:53 Page 15.13
EPITAXY
EPITAXY 15.13
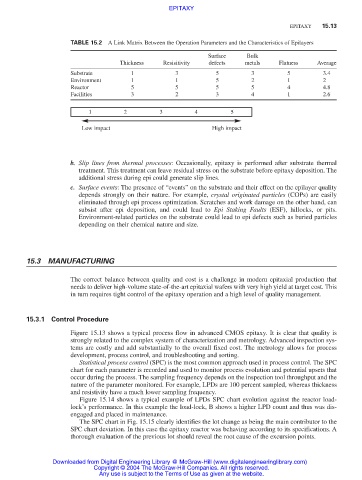
TABLE 15.2 A Link Matrix Between the Operation Parameters and the Characteristics of Epilayers
Surface Bulk
Thickness Resisitivity defects metals Flatness Average
Substrate 1 3 5 3 5 3.4
Environment 1 1 5 2 1 2
Reactor 5 5 5 5 4 4.8
Facilities 3 2 3 4 1 2.6
1 2 3 4 5
Low impact High impact
b. Slip lines from thermal processes: Occasionally, epitaxy is performed after substrate thermal
treatment. This treatment can leave residual stress on the substrate before epitaxy deposition. The
additional stress during epi could generate slip lines.
c. Surface events: The presence of “events” on the substrate and their effect on the epilayer quality
depends strongly on their nature. For example, crystal originated particles (COPs) are easily
eliminated through epi process optimization. Scratches and work damage on the other hand, can
subsist after epi deposition, and could lead to Epi Staking Faults (ESF), hillocks, or pits.
Environment-related particles on the substrate could lead to epi defects such as buried particles
depending on their chemical nature and size.
15.3 MANUFACTURING
The correct balance between quality and cost is a challenge in modern epitaxial production that
needs to deliver high-volume state-of-the-art epitaxial wafers with very high yield at target cost. This
in turn requires tight control of the epitaxy operation and a high level of quality management.
15.3.1 Control Procedure
Figure 15.13 shows a typical process flow in advanced CMOS epitaxy. It is clear that quality is
strongly related to the complex system of characterization and metrology. Advanced inspection sys-
tems are costly and add substantially to the overall fixed cost. The metrology allows for process
development, process control, and troubleshooting and sorting.
Statistical process control (SPC) is the most common approach used in process control. The SPC
chart for each parameter is recorded and used to monitor process evolution and potential upsets that
occur during the process. The sampling frequency depends on the inspection tool throughput and the
nature of the parameter monitored. For example, LPDs are 100 percent sampled, whereas thickness
and resistivity have a much lower sampling frequency.
Figure 15.14 shows a typical example of LPDs SPC chart evolution against the reactor load-
lock’s performance. In this example the load-lock, B shows a higher LPD count and thus was dis-
engaged and placed in maintenance.
The SPC chart in Fig. 15.15 clearly identifies the lot change as being the main contributor to the
SPC chart deviation. In this case the epitaxy reactor was behaving according to its specifications. A
thorough evaluation of the previous lot should reveal the root cause of the excursion points.
Downloaded from Digital Engineering Library @ McGraw-Hill (www.digitalengineeringlibrary.com)
Copyright © 2004 The McGraw-Hill Companies. All rights reserved.
Any use is subject to the Terms of Use as given at the website.