Page 229 - Semiconductor Manufacturing Handbook
P. 229

Geng(SMH)_CH15.qxd  04/04/2005  19:53  Page 15.14


                                                          EPITAXY

                   15.14  WAFER PROCESSING


                                                                Substrate
                                                                cleaning

                                                                Particles
                                                                inspection
                                              Maintenance                     Process tuning
                                                               Epi reactor
                                    Reactor monitoring;                               Process control:
                                    Metals, particles and  Sampling     Sampling       Thickness and
                                     intrinsic resistivity                           resistivity monitoring
                                                                Particles
                                                                inspection
                                                                  Slip

                                                             Nanotopography

                                                                Flatness

                                                             Post-epi cleaning

                                                                 Visual      Particles
                                                                inspection   inspection    Shipping
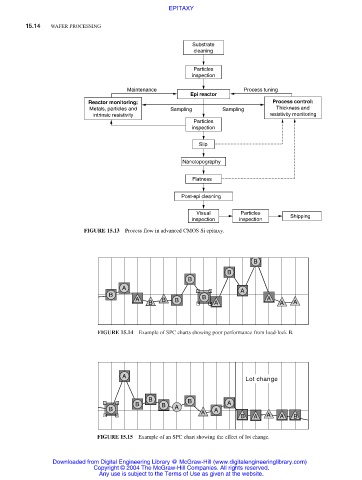
                                   FIGURE 15.13  Process flow in advanced CMOS Si epitaxy.


                                                                                 B
                                                                          B
                                                               B
                                             A                               A
                                         B
                                                 A      B  B       B                A
                                                    B                 A                 A  A


                                      FIGURE 15.14  Example of SPC charts showing poor performance from load-lock B.


                                             A
                                                                              Lot change
                                                    B          B
                                                 B      B                 A
                                         B                 A          A
                                                                  A
                                                                             B   A  A   A  B

                                      FIGURE 15.15  Example of an SPC chart showing the effect of lot change.


                          Downloaded from Digital Engineering Library @ McGraw-Hill (www.digitalengineeringlibrary.com)
                                     Copyright © 2004 The McGraw-Hill Companies. All rights reserved.
                                       Any use is subject to the Terms of Use as given at the website.
   224   225   226   227   228   229   230   231   232   233   234