
Page 285 - Semiconductor Manufacturing Handbook
P. 285
Geng(SMH)_CH19.qxd 04/04/2005 20:00 Page 19.12
INSPECTION, MEASUREMENT, AND TEST
19.12 FINAL MANUFACTURING
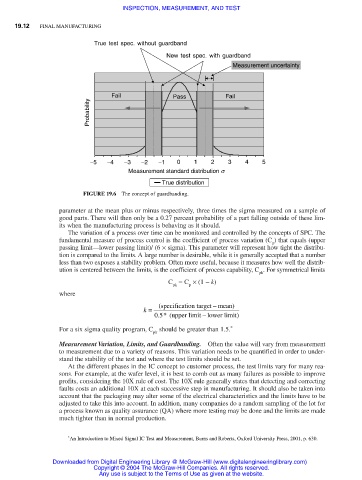
True test spec. without guardband
New test spec. with guardband
Measurement uncertainty
Fail Pass Fail
Probability
−5 −4 −3 −2 −1 0 1 2 3 4 5
Measurement standard distribution s
True distribution
FIGURE 19.6 The concept of guardbanding.
parameter at the mean plus or minus respectively, three times the sigma measured on a sample of
good parts. There will then only be a 0.27 percent probability of a part falling outside of these lim-
its when the manufacturing process is behaving as it should.
The variation of a process over time can be monitored and controlled by the concepts of SPC. The
fundamental measure of process control is the coefficient of process variation (C ) that equals (upper
p
passing limit—lower passing limit)/ (6 × sigma). This parameter will represent how tight the distribu-
tion is compared to the limits. A large number is desirable, while it is generally accepted that a number
less than two exposes a stability problem. Often more useful, because it measures how well the distrib-
ution is centered between the limits, is the coefficient of process capability, C . For symmetrical limits
pk
C = C × (1 − k)
pk p
where
k = (specification target − mean)
0.5* (upper limit − lower limit)
For a six sigma quality program, C should be greater than 1.5. *
pk
Measurement Variation, Limits, and Guardbanding. Often the value will vary from measurement
to measurement due to a variety of reasons. This variation needs to be quantified in order to under-
stand the stability of the test and where the test limits should be set.
At the different phases in the IC concept to customer process, the test limits vary for many rea-
sons. For example, at the wafer level, it is best to comb out as many failures as possible to improve
profits, considering the 10X rule of cost. The 10X rule generally states that detecting and correcting
faults costs an additional 10X at each successive step in manufacturing. It should also be taken into
account that the packaging may alter some of the electrical characteristics and the limits have to be
adjusted to take this into account. In addition, many companies do a random sampling of the lot for
a process known as quality assurance (QA) where more testing may be done and the limits are made
much tighter than in normal production.
* An Introduction to Mixed Signal IC Test and Measurement, Burns and Roberts, Oxford University Press, 2001, p. 630.
Downloaded from Digital Engineering Library @ McGraw-Hill (www.digitalengineeringlibrary.com)
Copyright © 2004 The McGraw-Hill Companies. All rights reserved.
Any use is subject to the Terms of Use as given at the website.