
Page 302 - Separation process engineering
P. 302
= 0.015. The solubility data give the compositions of the streams leaving the settler. Use Eq.
benz
(8-13) for equilibrium. At the boiling point of benzene (80.1°C), VP benz = 760 mm Hg and VP =
w
356.6 mm Hg (Perry and Green, 1997). Operation will be at a different temperature, but the ratio of
vapor pressures will be approximately constant.
C. Plan. Calculate equilibrium from Eq. (8-13):
This is a good approximation of VLE for x w in benz < 0.015. After that, we have a heterogeneous
azeotrope. Plot the curve represented by this value of α w-benz on a McCabe-Thiele diagram. (Two
diagrams will be used for accuracy.) Solve with the McCabe-Thiele method as a heterogeneous
azeotrope problem. Mass balances will be used to find flow rates leaving the settler.
D. Do it. Plot equilibrium:
where y and x are mole fracs of water in the benzene phase. This is valid for x ≤ 0.015. At the
w
w
w
solubility limit x = 0.015, we can determine the y value for the azeotrope,
w
w
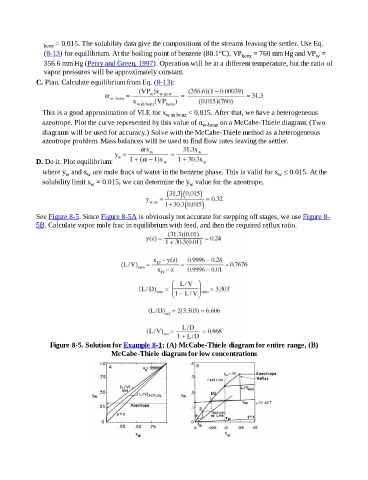
See Figure 8-5. Since Figure 8-5A is obviously not accurate for stepping off stages, we use Figure 8-
5B. Calculate vapor mole frac in equilibrium with feed, and then the required reflux ratio.
Figure 8-5. Solution for Example 8-1; (A) McCabe-Thiele diagram for entire range, (B)
McCabe-Thiele diagram for low concentrations