Page 149 - Shigley's Mechanical Engineering Design
P. 149

bud29281_ch03_071-146.qxd  11/24/09  3:02PM  Page 124 ntt 203:MHDQ196:bud29281:0073529281:bud29281_pagefiles:


                 124   Mechanical Engineering Design
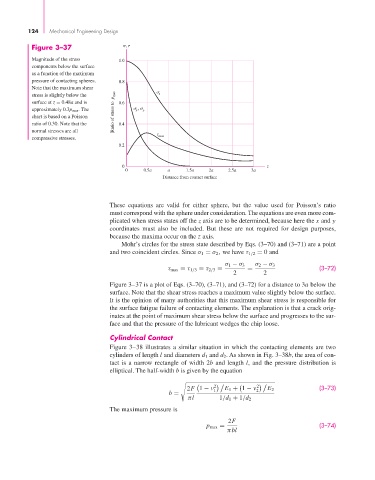
                  Figure 3–37                  ,

                  Magnitude of the stress    1.0
                  components below the surface
                  as a function of the maximum
                  pressure of contacting spheres.  0.8
                  Note that the maximum shear
                  stress is slightly below the            z
                  surface at z = 0.48a and is  0.6
                  approximately 0.3p max . The   Ratio of stress to  p max      ,   y
                                                  x
                  chart is based on a Poisson
                  ratio of 0.30. Note that the  0.4
                  normal stresses are all
                  compressive stresses.                  max
                                             0.2


                                              0                                           z
                                               0    0.5a    a    1.5a    2a    2.5a   3a
                                                          Distance from contact surface


                                          These equations are valid for either sphere, but the value used for Poisson’s ratio
                                          must correspond with the sphere under consideration. The equations are even more com-
                                          plicated when stress states off the z axis are to be determined, because here the x and y
                                          coordinates must also be included. But these are not required for design purposes,
                                          because the maxima occur on the z axis.
                                              Mohr’s circles for the stress state described by Eqs. (3–70) and (3–71) are a point
                                          and two coincident circles. Since σ 1 = σ 2 , we have τ 1/2 = 0 and
                                                                             σ 1 − σ 3  σ 2 − σ 3
                                                            τ max = τ 1/3 = τ 2/3 =  =                     (3–72)
                                                                                2        2
                                          Figure 3–37 is a plot of Eqs. (3–70), (3–71), and (3–72) for a distance to 3a below the
                                          surface. Note that the shear stress reaches a maximum value slightly below the surface.
                                          It is the opinion of many authorities that this maximum shear stress is responsible for
                                          the surface fatigue failure of contacting elements. The explanation is that a crack orig-
                                          inates at the point of maximum shear stress below the surface and progresses to the sur-
                                          face and that the pressure of the lubricant wedges the chip loose.
                                          Cylindrical Contact
                                          Figure 3–38 illustrates a similar situation in which the contacting elements are two
                                          cylinders of length l and diameters d 1 and d 2. As shown in Fig. 3–38b, the area of con-
                                          tact is a narrow rectangle of width 2b and length l, and the pressure distribution is
                                          elliptical. The half-width b is given by the equation


                                                                          2            2
                                                                  2F 1 − ν 1  E 1 + 1 − ν 2  E 2           (3–73)
                                                            b =
                                                                  πl        1/d 1 + 1/d 2
                                          The maximum pressure is
                                                                              2F
                                                                        p max =                            (3–74)
                                                                              πbl
   144   145   146   147   148   149   150   151   152   153   154