
Page 289 - Soil and water contamination, 2nd edition
P. 289
276 Soil and Water Contamination
In theory, the correlation coefficient could be +1, but the model predictions could be a factor
of 2 too large and/or could have a constant offset. To overcome this shortcoming, the Nash
efficiency coefficient has been introduced (Nash and Sutcliffe, 1970). The Nash efficiency
n
coefficient is defined as 1 minus the ratio of the residual sum of squares ~ x ( q) x 2
ˆ
i i
n i 1
to the original sum of squares of the observations ~ i x where x = the mean of the
2
x
i 1
observations, and may therefore vary between -∞ and +1. A value of 1 implies a perfect
model; a value less than zero implies that the mean of the observations is, on average, a better
estimate than the model prediction.
A paired Student’s t test can be used to test if the average difference between observed and
predicted values differs significantly from zero. This test is particularly convenient to use in
2
combination with the Pearson’s squared correlation coefficient (R ). The test statistic t is:
x x( q)
t (15.2)
s. d /. n
where (qx ) = the mean of the model predictions, s.d. = the sample standard deviation of the
mean differences between the observed and predicted values. The model is accepted if:
P t t (15.3)
0
where t = the critical t value for n – 1 degrees of freedom. The critical t values are also
0
tabulated in standard statistical textbooks.
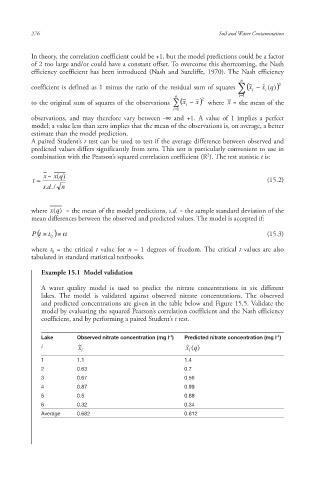
Example 15.1 Model validation
A water quality model is used to predict the nitrate concentrations in six different
lakes. The model is validated against observed nitrate concentrations. The observed
and predicted concentrations are given in the table below and Figure 15.5. Validate the
model by evaluating the squared Pearson’s correlation coefficient and the Nash efficiency
coefficient , and by performing a paired Student’s t test.
-1
Lake Observed nitrate concentration (mg l ) Predicted nitrate concentration (mg l )
-1
i ~ i ˆ x i (q )
x
1 1.1 1.4
2 0.63 0.7
3 0.67 0.56
4 0.87 0.99
5 0.5 0.88
6 0.32 0.34
Average 0.682 0.812
10/1/2013 6:45:22 PM
Soil and Water.indd 288
Soil and Water.indd 288 10/1/2013 6:45:22 PM