
Page 189 - Standard Handbook Of Petroleum & Natural Gas Engineering
P. 189
174 General Engineering and Science
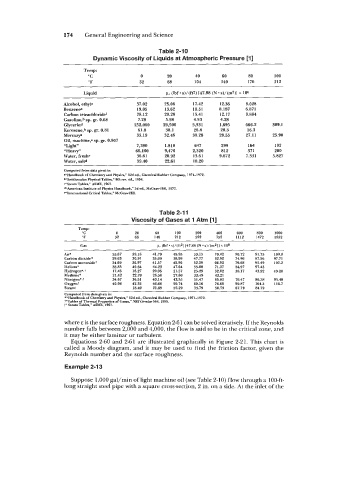
Table 2-10
Dynamic Viscosity of Liquids at Atmospheric Pressure [l]
Temp:
"C 0 20 40 60 80 100
"F 32 68 104 140 176 212
Alcohol, ethyla 37.02 25.06 17.42 12.36 9.028
Benzenea 19.05 13.62 10.51 8.187 6.871
Carbon tetrachloride' 28.12 20.28 15.41 12.17 9.884
Gasoline,b sp. gr. 0.68 7.28 5.98 4.93 4.28
Glycerind 252,000 29,500 5,931 1,695 666.2 309.1
Kerosene$' sp. gr. 0.81 61.8 38.1 26.8 20.3 16.3
Mercq 35.19 32.46 30.28 28.55 27.11 25.90
Oil, machine,. sp. gr. 0.907
"Light" 7,380 1.810 647 299 164 102
"Heavy" 66,100 9,470 2,320 812 371 200
Water, freshe 36.61 20.92 13.61 9.672 7.331 5.827
Water, saltd 39.40 22.61 18.20
Computed from data given in:
"'Handbook of Chemistry and Physics," 52d ed., Chemical Rubber Company, 1971-1972.
b"Smithonian Physical Tables," 9th rev. ed., 1954.
c"Steam Tables," ASME, 1967.
d"American Institute of Physics Handbook," 3d ed., MeCraw-Hill, 1972.
e"Intemational Critical Tables," McCmwHill.
Table 2-1 1
Viscosity of Gases at 1 Atrn [l]
Temp:
"C 0 20 60 100 200 400 600 800 1000
"F 32 68 140 212 392 752 I112 1472 I832
~~~~~~~~~~~~ ~~~ ~ ~~
Air' 35.67 39.16 41.79 45.95 53.15 70.42 80.72 91.75 100.8
Carbon dioxide* 29.03 30.91 35.00 38.99 47.77 62.92 74.96 87.56 97.71
Carbon monoxide+ 34.60 36.97 41.57 45.96 52.39 66.92 79.68 91.49 104.2
Helium* 38.85 40.54 44.23 47.64 55.80 71.27 84.97 97.43
Hydrogen*.t 17.43 18.27 20.95 21.57 25.29 32.02 38.17 43.92 49.20
Methane* 21.42 22.70 26.50 27.80 33.49 43.21
Nitrogen*.t 34.67 36.51 40.14 43.55 51.47 65.02 76.47 86.38 95.40
Oxygent 40.08 42.33 46.66 50.74 60.16 76.60 90.87 104.3 116.7
Steamt 18.49 21.89 25.29 33.79 50.79 67.79 84.79
Computed from data given in:
*"Handbook of Chemishy and Pb ies," 52d ed., Chemical Rubber Company, 1971-1972.
+-Tables of Thermal Roperties of%-," NBS Ctrmhr564, 1955.
I'' Steam Tables," ASME, 1967.
where E is the surface roughness. Equation 2-61 can be solved iteratively. If the Reynolds
number falls between 2,000 and 4,000, the flow is said to be in the critical zone, and
it may be either laminar or turbulent.
Equations 2-60 and 2-61 are illustrated graphically in Figure 2-21. This chart is
called a Moody diagram, and it may be used to find the friction factor, given the
Reynolds number and the surface roughness.
Example 2-1 3
Suppose 1,000 gal/min of light machine oil (see Table 2-10) flow through a 100-ft-
long straight steel pipe with a square cross-section, 2 in. on a side. At the inlet of the