
Page 22 - Sumatra Geology, Resources and Tectonic Evolution
P. 22
SEISMOLOGY & NEOTECTONICS 9
T R F
i Hypocentres above 40 km o " +++4o - 6o km onJy 200 100 0 100 200 300
o ) o qto o+o..~ ~ .
%* **" - . /Hypocentres 40-60 km o 0+~+., o+..++ ~ . I
oe
N e,++" L a t e * o o og~. o,~ ~ "~ .o :
o %~~ : o
o o o 1 O0
North
o ? o
T R o o F ~ I l~ 1200
o . . . eo'~ . . ~, . . : o : : - i
o 6
I
".., . . . . . . ~ - : ,~ o 00 .: o,~, o : a) I
".-$
~
o+ 9 9 9 o
./ I
+I~ COo "' , Simeulue
o Oo
,i.
Equator
T R F
200 100 0 100 200 300
o oGo o o o
0,~" o o
Oo o o
,,'-, o ~ " e~
: : . . . . o,, o ~o, ~ o I00
/ o
~ / o ",
300 kin - / 0
.....................
.... / +o / O
k
+
'.++~+ 40ku, o,,~* ] 9 o '~0s ,%: / o 1 200
+ +++: + +~+ I 6+ ~ ~ ' . I ~ o ~ ,e / : ~
'
+
I Central
+ 9 ........ ~ + , + +
:
+,+ ++++:+ ++++++++++.... I ... /o'| " <" ~g0 T 100 O R 100 F200 30g
"ore, o + o
~o obo( "V
I
+
.
++ ?++++++++++++++++++++;+++++++++ ....... io +,. +++ ~ o o oo o : o <ll._ bo 0 ,,.. o 0 o :
9 oi~o.Oo
+
+ ' % ~+ +++ + +'++ +++ +I ........ o ...... o * ,i '+ ...... : : .o~ <'*"~lRm~-T~..,, ~
.
+
9 ,'+::~:~+;++++++++:~++I + o .~.~ : :, .... i ~ +,~,.~ .
]++, ;.:,:)+ +i] . ,~o ~++~_~l[llm~ o ....
o
%o . . . . :~ :" : A~176176176 o Ioo
o <>~ ......
............... + + :i~':+i. i IO0~ 104~ o, oo
. . . . . . . . . . . . . ~ ................ o
~>o
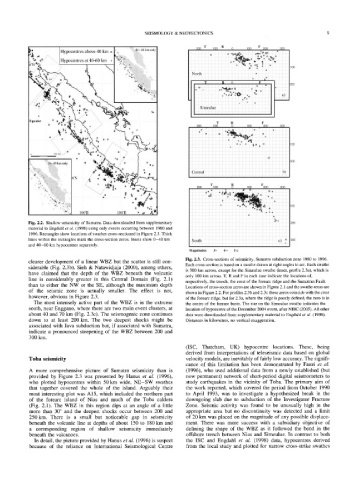
Fig. 2.2. Shallow selsmicity of Sumatra. Data downloaded from supplementary 2OO
material to Engdahl et al. (1998) using only events occurring between 1980 and
1996. Rectangles show locations of swathes cross-sectioned in Figure 2.3. Thick
lines within the rectangles mark the cross-section zeros. Insets show 0-40 km South c) .:~ 300
and 40-60 km hypocentres separately 9
Magnitudes 3 9 4 o 5 o
Fig. 2.3. Cross-sections of seismicity, Sumatra subduction zone 1980 to 1996.
clearer development of a linear WBZ but the scatter is still con- Each cross-section is based on a swathe drawn at right angles to arc. Each swathe
siderable (Fig. 2.3b). Sieh & Natawidjaja (2000), among others,
is 300 km across, except for the Simeulue swathe (inset, profile 2.3a), which is
have claimed that the depth of the WBZ beneath the volcanic only 100 km across. T, R and F in each case indicate the locations of,
line is considerably greater in this Central Domain (Fig. 2.1)
respectively, the trench, the crest of the forearc ridge and the Sumatran Fault.
than to either the NW or the SE, although the maximum depth Locations of cross-section zeros are shown in Figure 2.1 and the swathe areas are
of the seismic zone is actually smaller. The effect is not, shown in Figure 2.2. For profiles 2.3b and 2.3c these zeros coincide with the crest
however, obvious in Figure 2.3. of the forearc ridge, but for 2.3a, where the ridge is poorly defined, the zero is in
The most intensely active part of the WBZ is in the extreme the centre of the forearc basin. The star on the Simeulue swathe indicates the
south, near Enggano, where there are two main event clusters, at location of hypocentre of the December 2004 event, after NEIC (2005). All other
about 40 and 70 km (Fig. 2.3c). The seismogenic zone continues data were downloaded from supplementary material to Engdahl et al. (1998).
down to at least 200 km. The two deepest shocks might be Distances in kilometres, no vertical exaggeration.
associated with Java subduction but, if associated with Sumatra,
indicate a pronounced steepening of the WBZ between 200 and
300 km.
(ISC, Thatcham, UK) hypocentre locations. These, being
derived from interpretations of teleseismic data based on global
Toba seismicity velocity models, are inevitably of fairly low accuracy. The signifi-
cance of this limitation has been demonstrated by Fauzi et al.
A more comprehensive picture of Sumatra seismicity than is (1996), who used additional data from a newly established (but
provided by Figure 2.3 was presented by Hanus et al. (1996), now permanent) network of short-period digital seismometers to
who plotted hypocentres within 50 km wide, NE-SW swathes study earthquakes in the vicinity of Toba. The primary aim of
that together covered the whole of the island. Arguably their the work reported, which covered the period from October 1990
most interesting plot was A15, which included the northern part to April 1993, was to investigate a hypothesized break in the
of the forearc island of Nias and much of the Toba caldera downgoing slab due to subduction of the Investigator Fracture
(Fig. 2.1). The WBZ in this region dips at an angle of a little Zone. Seismic activity was found to be unusually high in the
more than 30 ~ and the deepest shocks occur between 200 and appropriate area but no discontinuity was detected and a limit
250km. There is a small but noticeable gap in seismicity of 20 km was placed on the magnitude of any possible displace-
beneath the volcanic line at depths of about 150 to 180 km and ment. There was more success with a subsidiary objective of
a corresponding region of shallow seismicity immediately defining the shape of the WBZ as it followed the bend in the
beneath the volcanoes. offshore trench between Nias and Simeulue. In contrast to both
In detail, the picture provided by Hanus et al. (1996) is suspect the ISC and Engdahl et al. (1998) data, hypocentres derived
because of the reliance on International Seismological Centre from the local study and plotted for narrow cross-strike swathes