
Page 85 - Sustainability in the Process Industry Integration and Optimization
P. 85
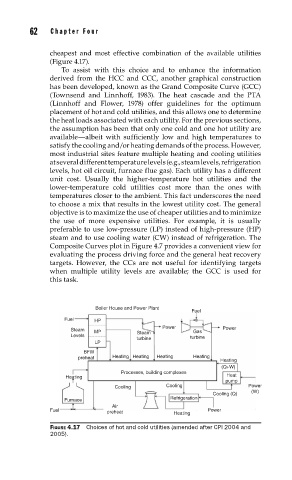
62   Cha p te r  F o u r


                     cheapest and most effective combination of the available utilities
                     (Figure 4.17).
                        To assist with this choice and to enhance the information
                     derived from the HCC and CCC, another graphical construction
                     has been developed, known as the Grand Composite Curve (GCC)
                     (Townsend and Linnhoff, 1983). The heat cascade and the PTA
                     (Linnhoff and Flower, 1978) offer guidelines for the optimum
                     placement of hot and cold utilities, and this allows one to determine
                     the heat loads associated with each utility. For the previous sections,
                     the assumption has been that only one cold and one hot utility are
                     available—albeit with sufficiently low and high temperatures to
                     satisfy the cooling and/or heating demands of the process. However,
                     most industrial sites feature multiple heating and cooling utilities
                     at several different temperature levels (e.g., steam levels, refrigeration
                     levels, hot oil circuit, furnace flue gas). Each utility has a different
                     unit cost. Usually the higher-temperature hot utilities and the
                     lower-temperature cold utilities cost more than the ones with
                     temperatures closer to the ambient. This fact underscores the need
                     to choose a mix that results in the lowest utility cost. The general
                     objective is to maximize the use of cheaper utilities and to minimize
                     the use of more expensive utilities. For example, it is usually
                     preferable to use low-pressure (LP) instead of high-pressure (HP)
                     steam and to use cooling water (CW) instead of refrigeration. The
                     Composite Curves plot in Figure 4.7 provides a convenient view for
                     evaluating the process driving force and the general heat recovery
                     targets. However, the CCs are not useful for identifying targets
                     when multiple utility levels are available; the GCC is used for
                     this task.


                                  Boiler House and Power Plant
                                                            Fuel
                         Fuel    HP
                                                    Power           Power
                           Steam  MP         Steam          Gas
                           Levels                          turbine
                                             turbine
                                 LP
                              BFW
                             preheat  Heating Heating  Heating  Heating
                                                                    Heating
                                                                    (Q+W)
                                        Processes, building complexes
                         Heating                                     Heat
                                                                     pump
                                       Cooling       Cooling               Power
                                                                            (W)
                                                                  Cooling (Q)
                         Furnace                      Refrigeration
                                      Air
                     Fuel            preheat           Heating  Power
                     FIGURE 4.17  Choices of hot and cold utilities (amended after CPI 2004 and
                     2005).