Page 87 - Sustainability in the Process Industry Integration and Optimization
P. 87

64   Cha p te r  F o u r


                      T* [°C]                     T* [°C]
                     300                         300
                           750                                         750
                            900                                           900
                        300
                     200                         200
                                                                      300
                        400                                          400
                     100                         100
                              1400                      1400
                            1200                    1200
                         1000                       1000
                      0       500    1000   1500  0      2000  4000  6000   8000
                                Q [kW]                          ΔH [kW]
                     FIGURE 4.19  Relation between the GCC (left) and the SCC (right) for the
                     streams in Table 4.2.


                     (a)  T* [°C]                 (b)  T* [°C]
                             HP steam                       HP steam
                        200                           200  MP
                                                         steam
                      PINCH                         PINCH

                        100                           100

                             Cooling Water                 Cooling Water
                                            Q [kW]                       Q [kW]
                          0      500    1000  1500     0       500   1000  1500
                                Single steam level          Multiple steam levels

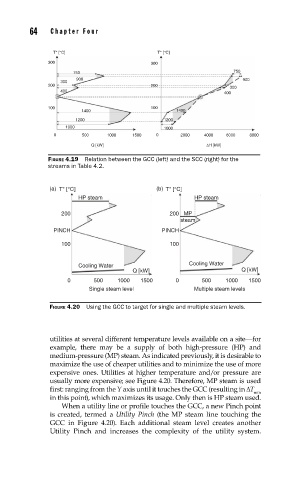
                     FIGURE 4.20  Using the GCC to target for single and multiple steam levels.


                     utilities at several different temperature levels available on a site—for
                     example, there may be a supply of both high-pressure (HP) and
                     medium-pressure (MP) steam. As indicated previously, it is desirable to
                     maximize the use of cheaper utilities and to minimize the use of more
                     expensive ones. Utilities at higher temperature and/or pressure are
                     usually more expensive; see Figure 4.20. Therefore, MP steam is used
                     first: ranging from the Y axis until it touches the GCC (resulting in ΔT
                                                                             min
                     in this point), which maximizes its usage. Only then is HP steam used.
                        When a utility line or profile touches the GCC, a new Pinch point
                     is created, termed a Utility Pinch (the MP steam line touching the
                     GCC in Figure 4.20). Each additional steam level creates another
                     Utility Pinch and increases the complexity of the utility system.
   82   83   84   85   86   87   88   89   90   91   92