Page 91 - Sustainability in the Process Industry Integration and Optimization
P. 91

68   Cha p te r  F o u r


                     T*                              T*


                        HP Steam                        HP Steam
                       Generation                       Generation


                                                        LP Steam use


                                  CW                            CW
                                            ΔH                              ΔH
                     FIGURE 4.24  Exploiting a GCC pocket for utility substitution.


                                T*


                           T CW


                                                  −5°C

                                                       −40°C

                                                           −70°C
                                                                      ΔH
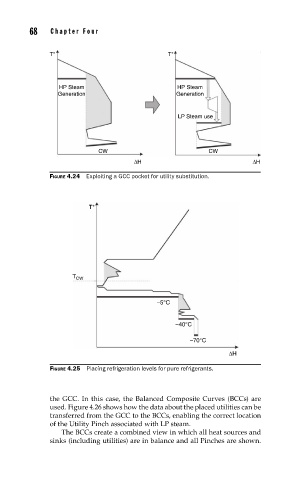
                     FIGURE 4.25  Placing refrigeration levels for pure refrigerants.


                     the GCC. In this case, the Balanced Composite Curves (BCCs) are
                     used. Figure 4.26 shows how the data about the placed utilities can be
                     transferred from the GCC to the BCCs, enabling the correct location
                     of the Utility Pinch associated with LP steam.
                        The BCCs create a combined view in which all heat sources and
                     sinks (including utilities) are in balance and all Pinches are shown.
   86   87   88   89   90   91   92   93   94   95   96