Page 376 - Sustainable On-Site CHP Systems Design, Construction, and Operations
P. 376

Optimal Sizing Using Computer Simulations—New School         349


                     Non-CHP Demand         Pattern 1     $/kW-mo
               Month         Pattern #      Demand Hour   Peak
                1            1               1            15.406
                2            1               2            15.406
                3            1               3            15.406
                4            1               4            15.406
                5            1               5            15.406
                6            1               6            15.406
                7            1               7            15.406
                8            1               8            15.406
                9            1               9            15.406
               10            1              10            15.406
               11            1              11            15.406
               12            1              12            15.406
                                            13            15.406
                                            14            15.406
                                            15            15.406
                                            16            15.406
                                            17            15.406
                                            18            15.406
                                            19            15.406
                                            20            15.406
                                            21            15.406
                                            22            15.406
                                            23            15.406
                                            24            15.406

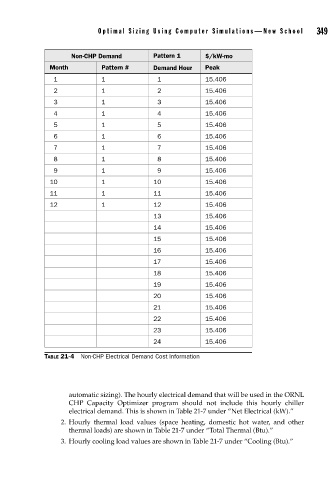
             TABLE 21-4  Non-CHP Electrical Demand Cost Information


                    automatic sizing). The hourly electrical demand that will be used in the ORNL
                    CHP Capacity Optimizer program should not include this hourly chiller
                    electrical demand. This is shown in Table 21-7 under “Net Electrical (kW).”
                  2.  Hourly thermal load values (space heating, domestic hot water, and other
                    thermal loads) are shown in Table 21-7 under “Total Thermal (Btu).”
                  3.  Hourly cooling load values are shown in Table 21-7 under “Cooling (Btu).”
   371   372   373   374   375   376   377   378   379   380   381