
Page 375 - Sustainable On-Site CHP Systems Design, Construction, and Operations
P. 375
348 Ca s e S t u d y 3
Electric Rates Pattern 1 Pattern 2
(Non-CHP Energy)
Energy Rate Energy Rate
Month Pattern # Hour ($/kWh) Hour ($/kWh)
1 2 1 0.1029 1 0.0903
2 2 2 0.1029 2 0.0903
3 2 3 0.1029 3 0.0903
4 2 4 0.1029 4 0.0903
5 2 5 0.1029 5 0.0903
6 1 6 0.1029 6 0.0903
7 1 7 0.1029 7 0.0903
8 1 8 0.1029 8 0.0903
9 1 9 0.1029 9 0.0903
10 2 10 0.1029 10 0.0903
11 2 11 0.1029 11 0.0903
12 2 12 0.1029 12 0.0903
13 0.1029 13 0.0903
14 0.1029 14 0.0903
15 0.1029 15 0.0903
16 0.1029 16 0.0903
17 0.1029 17 0.0903
18 0.1029 18 0.0903
19 0.1029 19 0.0903
20 0.1029 20 0.0903
21 0.1029 21 0.0903
22 0.1029 22 0.0903
23 0.1029 23 0.0903
24 0.1029 24 0.0903
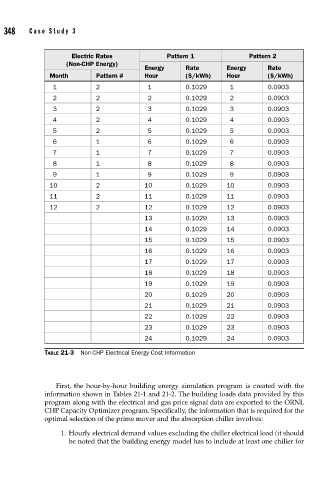
TABLE 21-3 Non-CHP Electrical Energy Cost Information
First, the hour-by-hour building energy simulation program is created with the
information shown in Tables 21-1 and 21-2. The building loads data provided by this
program along with the electrical and gas price signal data are exported to the ORNL
CHP Capacity Optimizer program. Specifically, the information that is required for the
optimal selection of the prime mover and the absorption chiller involves:
1. Hourly electrical demand values excluding the chiller electrical load (it should
be noted that the building energy model has to include at least one chiller for