
Page 377 - Sustainable On-Site CHP Systems Design, Construction, and Operations
P. 377
350 Ca s e S t u d y 3
Electric Rates Pattern 1 Pattern 2
(CHP Energy)
Energy Rate Energy Rate
Month Pattern # Hour ($/kWh) Hour ($/kWh)
1 2 1 0.06757 1 0.05551
2 2 2 0.06757 2 0.05551
3 2 3 0.06757 3 0.05551
4 2 4 0.06757 4 0.05551
5 2 5 0.06757 5 0.05551
6 1 6 0.06757 6 0.05551
7 1 7 0.06757 7 0.05551
8 1 8 0.06757 8 0.05551
9 1 9 0.12571 9 0.08793
10 2 10 0.12571 10 0.08793
11 2 11 0.12571 11 0.08793
12 2 12 0.12571 12 0.08793
13 0.12451 13 0.08793
14 0.12451 14 0.08793
15 0.12451 15 0.08793
16 0.12451 16 0.08793
17 0.12451 17 0.08793
18 0.12451 18 0.08793
19 0.12571 19 0.08793
20 0.12571 20 0.08793
21 0.12571 21 0.08793
22 0.12571 22 0.08793
23 0.06757 23 0.05551
24 0.06757 24 0.05551
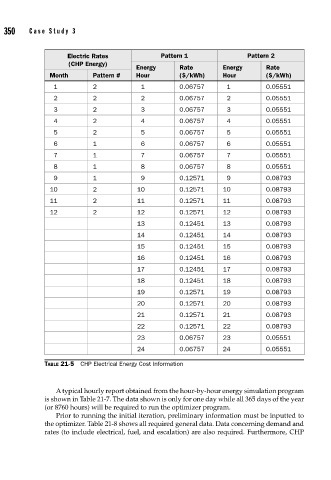
TABLE 21-5 CHP Electrical Energy Cost Information
A typical hourly report obtained from the hour-by-hour energy simulation program
is shown in Table 21-7. The data shown is only for one day while all 365 days of the year
(or 8760 hours) will be required to run the optimizer program.
Prior to running the initial iteration, preliminary information must be inputted to
the optimizer. Table 21-8 shows all required general data. Data concerning demand and
rates (to include electrical, fuel, and escalation) are also required. Furthermore, CHP