
Page 378 - Sustainable On-Site CHP Systems Design, Construction, and Operations
P. 378
Optimal Sizing Using Computer Simulations—New School 351
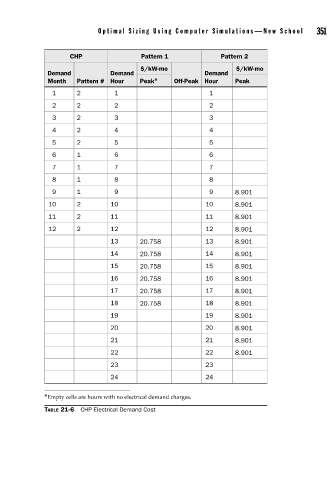
CHP Pattern 1 Pattern 2
$/kW-mo $/kW-mo
Demand Demand Demand
Month Pattern # Hour Peak * Off-Peak Hour Peak
1 2 1 1
2 2 2 2
3 2 3 3
4 2 4 4
5 2 5 5
6 1 6 6
7 1 7 7
8 1 8 8
9 1 9 9 8.901
10 2 10 10 8.901
11 2 11 11 8.901
12 2 12 12 8.901
13 20.758 13 8.901
14 20.758 14 8.901
15 20.758 15 8.901
16 20.758 16 8.901
17 20.758 17 8.901
18 20.758 18 8.901
19 19 8.901
20 20 8.901
21 21 8.901
22 22 8.901
23 23
24 24
* Empty cells are hours with no electrical demand charges.
TABLE 21-6 CHP Electrical Demand Cost