
Page 379 - Sustainable On-Site CHP Systems Design, Construction, and Operations
P. 379
352 Ca s e S t u d y 3
Total Chiller Net Heat DHW Total
Power Input Electrical Cooling Load Load Thermal
Month Day Hour (kW) (kW) (kW) (Btu) (Btu) (Btu) (Btu)
6 24 1 151 0 151 0 0 0 0
6 24 2 151 0 151 0 0 0 0
6 24 3 151 0 151 0 0 0 0
6 24 4 151 0 151 0 0 0 0
6 24 5 151 0 151 0 0 0 0
6 24 6 364 88 275 633,392 0 1,339 1,339
6 24 7 387 97 290 704,616 107,190 2,678 109,868
6 24 8 429 128 302 929,132 100,962 4,017 104,979
6 24 9 497 172 325 1,297,076 98,005 5,356 103,361
6 24 10 490 166 325 1,199,914 92,565 5,356 97,921
6 24 11 499 174 325 1,305,016 92,887 6,695 99,582
6 24 12 542 204 338 1,819,809 96,918 5,356 102,274
6 24 13 550 207 343 1,869,372 98,185 5,356 103,541
6 24 14 556 213 343 1,964,145 98,334 4,017 102,351
6 24 15 554 211 343 1,927,063 98,807 2,678 101,485
6 24 16 544 206 338 1,850,608 99,296 4,017 103,313
6 24 17 525 199 327 1,730,005 102,681 1,339 104,020
6 24 18 195 0 195 0 0 0 0
6 24 19 198 0 198 0 0 0 0
6 24 20 190 0 190 0 0 0 0
6 24 21 190 0 190 0 0 0 0
6 24 22 190 0 190 0 0 0 0
6 24 23 170 0 170 0 0 0 0
6 24 24 151 0 151 0 0 0 0
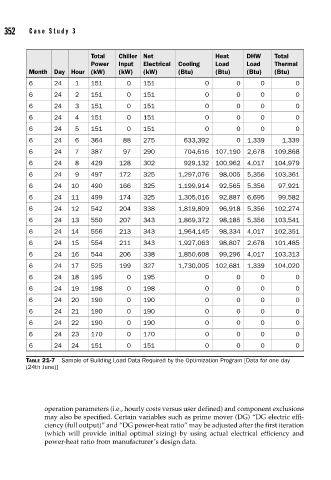
TABLE 21-7 Sample of Building Load Data Required by the Optimization Program [Data for one day
(24th June)]
operation parameters (i.e., hourly costs versus user defined) and component exclusions
may also be specified. Certain variables such as prime mover (DG) “DG electric effi-
ciency (full output)” and “DG power-heat ratio” may be adjusted after the first iteration
(which will provide initial optimal sizing) by using actual electrical efficiency and
power-heat ratio from manufacturer’s design data.