
Page 108 - The Geological Interpretation of Well Logs
P. 108
- THE GEOLOGICAL INTERPRETATION OF WELL LOGS -
3 8
schematic representation illustrated (Figure 8.7) of a
straight wave path through a sediment is, not surprisingly,
18.00} ~ 2 :
incorrect. Hf an incorrect ray path is the cause of the gener-
vee
18.00 or ; al error, then the path through the fluid is longer than
ae PEAPENOICULAR FIT
. LINE
BEST
expected (or shorter through the matrix), hence the over-
FORA
oe te ' , B-- 3241+ ‘AL
14.00 ate SY estimation of porosity. This is onty one possibility.
on ie
For unconsolidated sediments, most logging companies
. “ Th
fer + tees
provide compaction correction coefficients, based on
re .
scot wr ates cross-plotting sonic porosities and density- or neutron-
B 2 10.00
te 4
log porosities. It is, however, best to avoid using the sonic
tape we
& FR,
g 8.00- .* a * log to calculate porosity in unconsolidated formations
tek :
. ‘ (Sarmiento, 1961).
oa often % *
fe: When gas replaces liquid in the formation, the ume-
1 ote 1 deeply into the formation, there is often sufficient gas in
t os {
4.00- BS a 2 average graph no longer applies (i.e., V, is replaced by V,_
and V_). Even though the sonic pulse does not penetrate
Ave
2.00- i% the invaded zone to affect the velocity. Indeed, the effect
1
4
L
1
id
4
can be used to identify gaseous hydrocarbons when a
WH 4.00 48.00 5200 56.00 6.00 B40 88.00 72.00 36,0 =&©.00
1
DELTA fFT gas/water contact is present (Figure 8.10). To estimate
pec
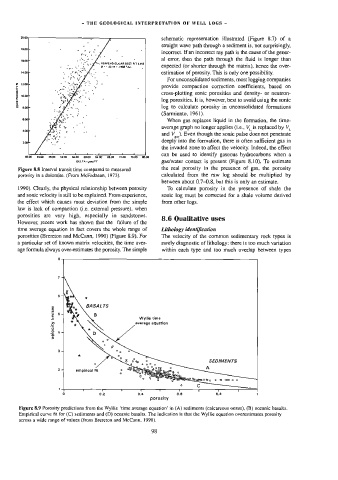
Figure 8.8 Interval transit time compared to measured the real porosity in the presence of gas, the porosity
porosity in a dolomite. (From McFadzean, 1973). calculated from the raw log should be multiplied by
between about 0.7-0.8, but this is only an estimate.
1990). Clearly, the physical relationship between porosity To calculate porosity in the presence of shale the
and sonic velocity is still to be explained. From experience, sonic log must be corrected for a shale volume derived
the effect which causes most deviation from the simple from other logs.
law is lack of compaction (i.e. external pressure), when
porosities are very high, especially in sandstones.
8.6 Qualitative uses
However, recent work has shown that the failure of the
time average equation in fact covers the whole range of Lithology identification
porosities (Brereton and McCann, 1990) (Figure 8.9). For The velocity of the common sedimentary rock types is
a particular set of known matrix velocities, the time aver- rarely diagnostic of lithology: there is too much variation
age formula always over-estimates the porosity. The simple within each type and too much overlap between types
*
km/sec Wyllie time
*
velocity * average equation
34
S38 ° 3 Sogmoem, © & amo oO
;
2- empirical ft é 8 8, A SEDIMENTS
Cc
°
7
T
Tm
T
T
T
1
T
Tm
a 0.2 0.4 0.8 0.8 1
porosity
Figure 8.9 Porosity predictions from the Wyllie ‘time average equation’ in (A) sediments (calcareous oozes), (B) oceanic basalts.
Empirical curve fit for (C) sediments and (D) oceanic basalts. The indication is that the Wyllie equation overestimates porosity
across a wide range of values (from Brereton and McCann, 1990).
98