Page 110 - The Geological Interpretation of Well Logs
P. 110

~  THE  GEOLOGICAL  INTERPRETATION  OF  WELL  LOGS  -

              CALIPER  laches    INTERVAL  TRANSIT  TIME    It  is  probable  that  the  sensitivity  of  the  sonic  to  bed-
           v1             21
              a    f_»   4.   LiTH.
        (a)                      140s   moilliseconds   40   ding,  as  well  as  to  texture  at  a  smaller  scale,  is  because

           OGAWA  RAY  fPI_100     pa             2800

                                                          the  detected  signals  physically  travel  up  (and  down)
                                          Cc
                                                 >        through  the  formation.  Any  horizontal  feature,  such  as
                                                          bedding,  must  be  crossed  and  will  affect  the  response.
                                                          This  is  well  illustrated  in  shales  where  finely  laminated
                                                          intervals  have  a  different  response  to  massive  intervals.
                                                          The  example  (Figure  8.14)  shows  a  shallow  marine  shale
                                 23
                                 sé
                                  oe  &          L
                                                          cycle  in  which  the  laminated  section  at  the  base  shows
                                 >
                                 =  @                     higher  interval  transit  times  (lower  velocity)  than  the
                                 oO              r
                                 an              r        more  massive,  upper  section.
                                 hK  »  a0   :   L  br  2850   sonic  log  response  may  not  be  known  and  the  difficulty
                                 ®  It
                                  >
                                                            In  many  cases  the  exact  textural  effects  causing  the
                                   =
                                 aE

                                                          in  calculating  porosity  from  the  sonic  is  a  demonstration
                                 zg
                                                          of  this.  An  example  of  textural  changes  in  turbidites  is  an
                                 oS
                                                    a  r   ~  =  Q  a   illustration  (Figure  8.15).  The  consistently  low  gamma
                                                 LL

                                 20

                                  oh
                                  rue
                                                   =
                                                          Tay  response  suggests  that  there  are  no  compositional
                                                          changes  and  yet  the  sonic  shows  distinct  variations.
                                                 -   O    Undoubtedly  porosity  change  occurs,  but  there  are  also
                                                          changes  in  grain  size  and  bedding  (sedimentary  struc-
                                                          tures).  It  is  not  possible  to  extract,  separate  and  identify
        (bo)
                                                          each  individual  influence.
                                  sand   més)             Correlation  —  sonic  log  character
                                    4350
                                  velocity                The  sonic  transit  time  of  a  formation  is  a  very  distinctive
        bit  si                     «                     characteristic  although,  as  indicated,  the  precise  textural
                                  <                       and  lithological  (compositional)  causes  are  difficult  to
                                  shale   m/s}            define.  Rather  like  colour,  it  is  not  diagnostic  of  a  partic-
                                                          ular  lithology  but  in  some  formations  it  is  very  typical
                                  yelocity   (3300        and  slight  changes  indicate  subtle  formation  changes.
                                                          The  sequence  illustrated  (Figure  8.16)  is  entirely  shaly:
                                        3000
                                                          cuttings  and  side-wall  cores  find  only  shale.  The  sonic  log,

                                                          however,  picks  out  small  variations,  probably  in  texture,
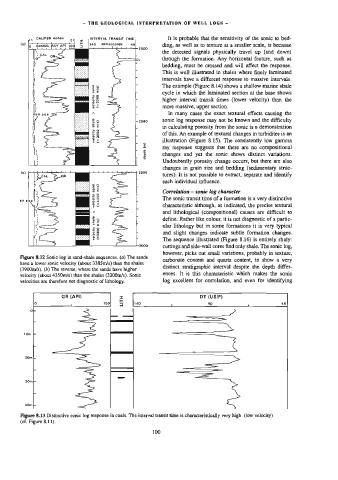
        Figure  8.12  Sonic  log  in  sand-shale  sequences.  (a)  The  sands
                                                          carbonate  content  and  quartz  content,  to  show  a  very
        have  a  lower  sonic  velocity  (about  3385m/s)  than  the  shales
                                                          distinct  stratigraphic  interval  despite  the  depth  differ-
        (3900m/s).  (6)  The  reverse,  where  the  sands  have  higher
                                                          ences.  It  is  this  characteristic  which  makes  the  sonic
        velocity  (about  4350m/s}  than  the  shales  (3300m/s).  Sonic
        velocities  are  therefore  not  diagnostic  of  lithology.   log  excellent  for  correlation,  and  even  for  identifying

                       GR  (API)           =x                          DT  (US/F}
             0           4           150   5    140          1            30            '           40


            Coe
            LL                          eo
          tom  -                               |
                                        a
          20m


          40m  -
                                          ~
          30m
        Figure  8.13  Distinctive  sonic  log  response  in  coals.  The  interval  transit  time  is  characteristically  very  high  (low  velocity)
        (cf.  Figure  8.11).
                                                       100
   105   106   107   108   109   110   111   112   113   114   115