
Page 115 - The Geological Interpretation of Well Logs
P. 115
- SONIC OR ACOUSTIC LOGS -
200 -
° . © hon-source rack shale
ze 4 ®@ source rock shale
3 ° bead © non-source rock imeasione
> 4 m source rock limesions
m
~~ e A coal
oD
E =
o
c
os
= 4
ao
<€
$
*
1003
904
204
.
704 q « .
4
805
60-poeemt yr rr Sey yet Tr
0.60 1.00 25 6.0 7.6 10.0 265 50 476 100 260 660 1000 2600 6000 10 GCO
R 78°F <onm m)
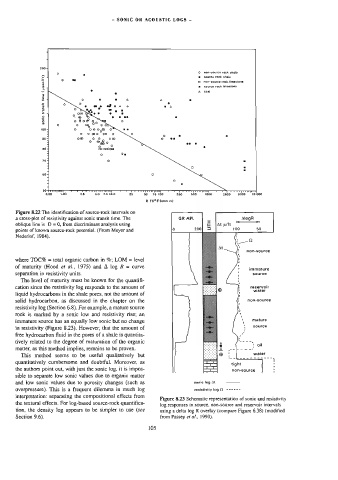
Figure 8.22 The identification of source-rock intervals on
a cross-plot of resistivity against sonic transit time. The
oblique line is D = 0, from discriminant analysis using
points of known source-rock potential. (From Meyer and
Nederlof, 1984).
.
Q
“\
non-source
where TOC% = total organic carbon in %; LOM = level
es
of maturity (Hood et al., 1975) and A log R = curve immature
separation in resistivity units. source
The level of maturity must be known for the quantifi-
cation since the resistivity log responds to the amount of reservoir
water
liquid hydrocarbons in the shale pores, not the amount of
solid hydrocarbon, as discussed in the chapter on the non-source
resistivity log (Section 6.8). For example, a mature source
rock is marked by a sonic low and resistivity rise; an
immature source has an equally low sonic but no change \ mature
source
in resistivity (Figure 8.23). However, that the amount of
free hydrocarbon fluid in the pores of a shale is quantita-
tively related to the degree of maturation of the organic
matter, as this method implies, remains to be proven.
This method seems to be useful qualitatively but
quantitatively cumbersome and doubtful. Moreover, as ee
the authors point out, with just the sonic log, it is impos-
sible to separate low sonic values due to organic matter
and low sonic values due to porosity changes (such as sonic log Al
overpressure). This is a frequent dilemma in much log resistivity log Q
interpretation: separating the compositional effects from
Figure 8.23 Schematic representation of sonic and resistivity
the textural effects. For log-based source-rack quantitica-
log responses in source, non-source and reservoir intervals
tion, the density log appears to be simpler to use (see using a delta log R overlay (compare Figure 6.38) (modified
Section 9.6). from Passey et al., 1990).
105