Page 111 - The Geological Interpretation of Well Logs
P. 111

-  SONIC  OR  ACOUSTIC  LOGS  -


           GAMMA  RAY  API        INTEAVAL  TRANSIT  TIME
        50                156           140   At  pitt   40


                                                                  GAMMA  RAY        LITH   INTERVAL  TRANSIT  TIME
               <=
                                                                      API
                                                                                               At  ptt
                                                                                                         90
                                                                                       140
                                                                               100


    22300m                                                         2?                        =
                                                          2725
    2926m A                                                                                       y   —s
          oS                                              2750

                                                                                                   Le
                                                           metres
                                                           depth,
       KE                          —  finely  laminated  shale                                     NN
          L_]  sit        H  shale
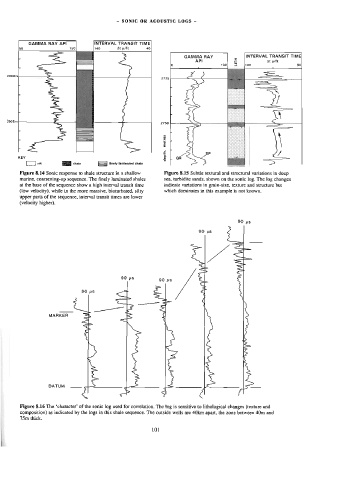
        Figure  8.14  Sonic  response  to  shale  structure  ia  a  shallow   Figure  8,15  Subtle  textural  and  structural  variations  in  deep
        marine,  coarsening-up  sequence.  The  finely  laminated  shales   sea,  turbidite  sands,  shown  on  the  sonic  log.  The  log  changes
        at  the  base  of  the  sequence  show a  high  interval  transit  time   indicate  variations  in  grain-size,  texture  and  structure  but
        (low  velocity),  while  in  the  more  massive,  bioturbated,  silty   which  dominates  in  this  example  is  not  known.
        upper  parts  of  the  sequence,  interval  transit  mes  are  lower
        (velocity  higher),


                                                                                     90  RS

                                                                       90  us


                                                                                       —
                                                                                       —
                                                                                       b
                                                                         f
                                            90   ps
                                                         90  xs          bye"
                                          <]                Yn
                              90  &   ps     =                           v
                           a              =     Wi   v                   a™,
                                   a  ad
                  MARKER      =
                               a
                              =            ~


                                                                                         wry


                                           st

                                                                                     7
                                             q
                  DATUM
                                e

                              é                           $            é
        Figure  8.16  The  ‘character’  of  the  sonic  log  used  for  correlation.  The  tog  is  sensitive  to  lithological  changes  (texture  and
        composition)  as  indicated  by  the  logs  in  this  shale  sequence.  The  outside  wells  are  40kim  apart,  the  zone  between  40m  and
        75  thick.
                                                      101
   106   107   108   109   110   111   112   113   114   115   116