Page 109 - The Geological Interpretation of Well Logs
P. 109

-  SONIC  OR  ACOUSTIC  LOGS  -


                »
                2       INTERVAL  TRANSIT  TIME                   INTERVAL  TRANSIT  TIME  wift  al
                2          microseconds  per  loot        200  160   100,   80   79   80   so   40

                                 T
                =             T9’Ry2’Ro
                3   hh40         90                                VELOCITY  kiloleei/second

                                                          L   §   1   2   1   L   10  J.   1   1s  pa   dl   po   2s   $9
                                                                                                     ll
                                                                                    20

                                                                                 Igneous
                                                         oll
                                                                                a
                           gas   =)      |                =  water           metamorphic   =
                           oy            \y                 =               =        =
                           yelocities|lowered                                    anhydrite
                                                                             oceanic  basalts
                                         it
                                i
                                                               coals
                                                                          salt    _—_——_
                                                                          —_

                                                                                      dolomitas
                                                                          =                 =
                                                                           (chalks)  limestones


                                                                      sandstones


                                                                    shales

                                                                         4
                                                                   a
                                                              2
                                                                                                            5
                                                                                                    a
                                                                                    6
                                                                                         7
                                                                          VELOCITY  km/second
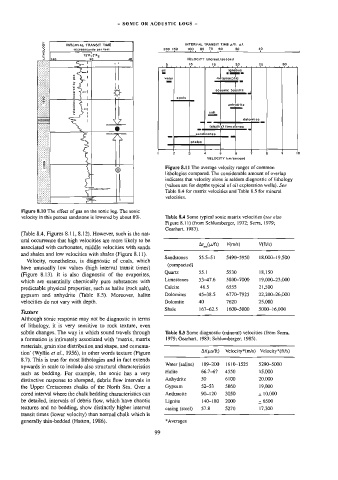
                                                           Figure  8.11  The  average  velocity  ranges  of  common

                                                           lithologies  compared.  The  considerable  amount  of  overlap
                                                           indicates  that  velocity  alone  is  seldom  diagnostic  of  lithology
                                                           {values  are  for  depths  typical  of  oil  exploration  wells).  See
                                                           velocities.
                  i                                        Table  8.4  for  matrix  velocities  and  Table  8.5  for  mineral

        Figure  8.10  The  effect  of  gas  on  the  sonic  tog.  The  sonic
        velocity  in  this  porous  sandstone  is  lowered  by  about  8%.   Table  8.4  Some  typical  sonic  matrix  velocities  (see  also
                                                           Figure  8,11)  (from  Schlumberger,  1972;  Serra,  1979;
                                                           Gearhan,  1983).
        (Table  8.4,  Figures  8.11,  8.12).  However,  such  is  the  nat-

        ural  occurrence  that  high  velocities  are  more  likely  to  be
                                                                       Ar (uift)   Vins)    V(fvs)
        associated  with  carbonates,  middle  velocities  with  sands

        and  shales  and  jow  velocities  with  shales  (Figure  8.11).
                                                           Sandstones   55.5-$1   5490-5950   18,000-19,500
          Velocity,  nonetheless,  is  diagnostic  of  coals,  which
                                                            {compacted)
        have  unusually  low  values  (high  interval  transit  times)
                                                          Quartz       55.]      5530       18,150
        (Figure  8.13).  It  is  also  diagnostic  of  the  evaporites,
        which  are  essentially  chemically  pure  substances  with   Limestones   5347.6   5800-7000   19,000-23,000
        predictable  physical  properties,  such  as  halite  (rock  salt),   Calcite   46.5   6555   21,500
        gypsum  and  anhydrite  (Table  8.5).  Moreover,  halite   Dolomites   45-38.5   6770-7925   22,200-26,000
        velocities  do  not  vary  with  depth.            Dolomite    40       7620        25,000
                                                           Shale       167-62.5   1600-5000    5000-16,000
        Texture

        Although  sonic  response  may  not  be  diagnostic  in  terms
        of  lithology,  it  is  very  sensitive  to  rock  texture,  even
        subtle  changes.  The  way  in  which  sound  travels  through   Table  8.5  Some  diagnostic  (mineral)  velocities  (from  Serra,
        a  formation  is  intimately  associated  with  ‘matrix,  matrix   1979;  Gearhart,  1983;  Schlumberger,  1985).
        materials,  grain  size  distribution  and  shape,  and  cementa-
                                                                        At(usift)   Velocity*(m/s)   Velocity*(fUs)
        tion’  (Wylie  et  al,,  1956),  in  other  words  texture  (Figure

        8.7).  This  is  true  for  most  lithologies  and  in  fact  extends
                                                           Water  (saline)   189-200   1610-1525   5290-5000
        upwards  in  scale  to  include  also  structural  characteristics
                                                           Halite       66.7-67   4550      15,000
        such  as  bedding.  For  example,  the  sonic  has  a  very
                                                          Anhydrite     50      6100        20,000
        distinctive  response  to  slumped,  debris  flow  intervals  in
        the  Upper  Cretaceous  chalks  of  the  North  Sea.  Over  a   Gypsum   $2-53   5860   19,000
        cored  interval  where  the  chalk  bedding  characteristics  can   Anthracite   90-120   3050   =  10,000
        be  detailed,  intervals  of  debris  flow,  which  have  chaotic   Lignite   140-180   2000   ~  6500
        textures  and  no  bedding,  show  distinctly  higher  interval   casing  (steel)   57.8   5270   17,300
        transit  mes  (lower  velocity)  than  normal  chalk  which  is
        generally  thin-bedded  (Hatton,  1986).           * Averages
                                                       99
   104   105   106   107   108   109   110   111   112   113   114