
Page 72 -
P. 72
System Hydraulics
3.6.4 Example 3-B
From the previous Figure 3.21, it can be noted that the static head on the system
shown will change from that calculated in Chapter 3.6.3 above, only once the
system is fully charged.
The previous calculation used the static head 'to the highest point in the line'
and this is necessary in order to ensure that the system is fully charged with
liquid. However, once the system is full, a syphon effect will kick in, and this will
require the pump to raise the liquid no further than the 40 foot elevation.
Consequently, the Total Head can be calculated as follows:
H = Hs + Hsd + Hv + Hf
-- 50 + 0 + 0.775 + 9.0
= 60 feet
Therefore design operating condition = 200 gpm @ 60 feet of Head
3.6.5 System curve revisited
In each of the above examples, we have only identified the design flow
conditions required. By working out the same equations at 50% and
120% of the design flow, we can draw a complete system curve for each
example.
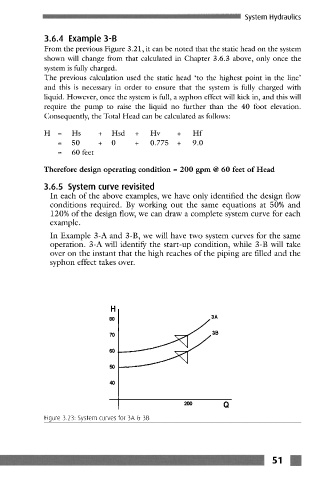
In Example 3-A and 3-B, we will have two system curves for the same
operation. 3-A will identify the start-up condition, while 3-B will take
over on the instant that the high reaches of the piping are filled and the
syphon effect takes over.
H
8O 3A
70 3B
60
50
40
200 Q
Figure 3.23- System curves for 3A ~ 3B