
Page 99 -
P. 99
The Practical Pumping Handbook ~::::: .......... ::::::::::::::::::::::::::::::::::::::::::::::: ............... :::::::::::::::::::::::: IIIBB!EE
flow rate than was originally
planned. From this point the H
Variable System will slowly move A
vertically upwards to the Ultimate
System. This will bring the
operating point back along the
pump curve to the Design Flow
and a smooth operating condition. Lowest 1
As a result of this decision, the
pump will therefore be operating
for most of the time under adverse Design Q
conditions which will inevitably Flow /
result in poor reliability and Figure 5.6: System curve with pump A
premature failure. In addition, the
batch will be transferred at a much
higher speed than was anticipated as the pump will always be operating
at a flow rate higher than was selected.
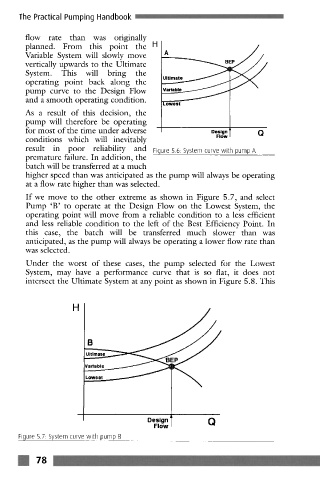
If we move to the other extreme as shown in Figure 5.7, and select
Pump 'B' to operate at the Design Flow on the Lowest System, the
operating point will move from a reliable condition to a less efficient
and less reliable condition to the left of the Best Efficiency Point. In
this case, the batch will be transferred much slower than was
anticipated, as the pump will always be operating a lower flow rate than
was selected.
Under the worst of these cases, the pump selected for the Lowest
System, may have a performance curve that is so flat, it does not
intersect the Ultimate System at any point as shown in Figure 5.8. This
H
B
Design Q
Flow
Figure 5.7. System curve with pump B
m 78