
Page 138 - Theory and Design of Air Cushion Craft
P. 138
Skirt/terrain interaction drag 121
0.12
0.08 -
0.04 -
0.4 0.6 0.8 1.0 1.2
Fr,=vjgl c
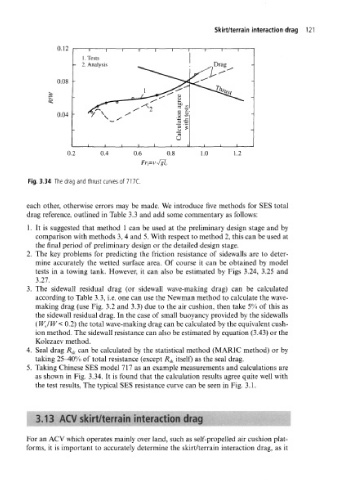
Fig. 3.34 The drag and thrust curves of 717C.
each other, otherwise errors may be made. We introduce five methods for SES total
drag reference, outlined in Table 3.3 and add some commentary as follows:
1. It is suggested that method 1 can be used at the preliminary design stage and by
comparison with methods 3, 4 and 5. With respect to method 2, this can be used at
the final period of preliminary design or the detailed design stage.
2. The key problems for predicting the friction resistance of sidewalls are to deter-
mine accurately the wetted surface area. Of course it can be obtained by model
tests in a towing tank. However, it can also be estimated by Figs 3.24, 3.25 and
3.27.
3. The sidewall residual drag (or sidewall wave-making drag) can be calculated
according to Table 3.3, i.e. one can use the Newman method to calculate the wave-
making drag (use Fig. 3.2 and 3.3) due to the air cushion, then take 5% of this as
the sidewall residual drag. In the case of small buoyancy provided by the sidewalls
(WJW< 0.2) the total wave-making drag can be calculated by the equivalent cush-
ion method. The sidewall resistance can also be estimated by equation (3.43) or the
Kolezaev method.
4. Seal drag R^ can be calculated by the statistical method (MARIC method) or by
taking 25-40% of total resistance (except R sk itself) as the seal drag.
5. Taking Chinese SES model 717 as an example measurements and calculations are
as shown in Fig. 3.34. It is found that the calculation results agree quite well with
the test results, The typical SES resistance curve can be seen in Fig. 3.1.
'3.13 ACV skirt/terrain interaction drag : ; ; ; ' ; 'ih/rh^l
For an ACV which operates mainly over land, such as self-propelled air cushion plat-
forms, it is important to accurately determine the skirt/terrain interaction drag, as it