
Page 58 - Vibrational Spectroscopic Imaging for Biomedical Applications
P. 58
Algal Cells, Cartilage, and IRENI 35
design of the beamline. It is clear that the beams are not square to the
orientation of the FPA, which is due to an optical rotation of the beams
in the Bruker Vertex 70 spectrometer (Fig. 2.3). In practice, the con-
denser is placed slightly out of focus to homogeneously illuminate
the sample plane as shown in Fig. 2.3a.
2.2.2 Initial Measurements with IRENI
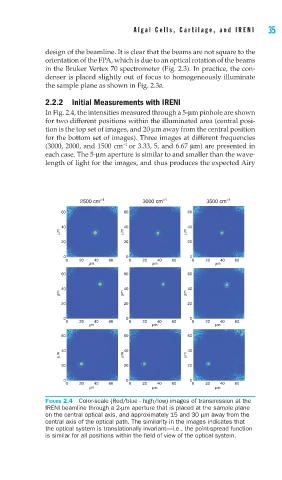
In Fig. 2.4, the intensities measured through a 5-μm pinhole are shown
for two different positions within the illuminated area (central posi-
tion is the top set of images, and 20 μm away from the central position
for the bottom set of images). Three images at different frequencies
–1
(3000, 2000, and 1500 cm or 3.33, 5, and 6.67 μm) are presented in
each case. The 5-μm aperture is similar to and smaller than the wave-
length of light for the images, and thus produces the expected Airy
2500 cm –1 3000 cm –1 3500 cm –1
60 60 60
40 40 40
μm μm μm
20 20 20
0 0 0
0 20 40 60 0 20 40 60 0 20 40 60
μm μm μm
60 60 60
40 40 40
μm μm μm
20 20 20
0 0 0
0 20 40 60 0 20 40 60 0 20 40 60
μm μm μm
60 60 60
40 40 40
μm μm μm
20 20 20
0 0 0
0 20 40 60 0 20 40 60 0 20 40 60
μm μm μm
FIGURE 2.4 Color-scale (Red/blue - high/low) images of transmission at the
IRENI beamline through a 2-μm aperture that is placed at the sample plane
on the central optical axis, and approximately 15 and 30 μm away from the
central axis of the optical path. The similarity in the images indicates that
the optical system is translationally invariant—i.e., the point-spread function
is similar for all positions within the fi eld of view of the optical system.