
Page 57 - Vibrational Spectroscopic Imaging for Biomedical Applications
P. 57
34 Cha pte r T w o
The collimated beams are accepted by a Bruker Vertex 70 spec-
trometer, and transported to a Hyperion 3000 IR microscope. An opti-
30
cal arrangement that is similar to one proposed by Carr et al. has
been implemented. In transmission, the microscope is equipped with
a 20× (modified ATR objective), 0.6 NA Schwarzchild condenser that
2
focuses the beam to 40 × 60 μm at the sample plane. This has been
predicted theoretically and verified experimentally. Theoretically, an
optical ray trace simulation of the overlapped beams, where the dis-
tances between the beams were optimized to create a homogeneous
illumination at the sample plane, was performed. Thus, the gaussian
tails of the individual neighboring beams are overlapped. This was
confirmed with an experimental measurement, illuminating the FPA
with the synchrotron source. The beam is collected by a 74×, 0.6 NA
Schwarzchild objective and refocused onto a 128 × 128 pixel FPA
2
detector, where the pixels are each 40 × 40 μm . The 74× magnification
2
creates an effective geometric illumination of 0.54 × 0.54 μm /pixel at
the sample plane.
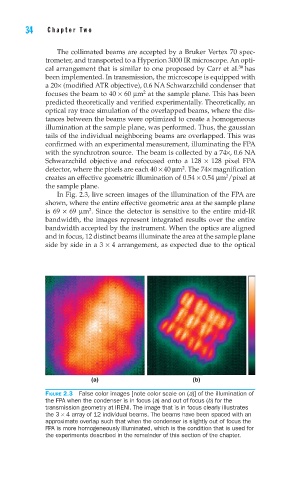
In Fig. 2.3, live screen images of the illumination of the FPA are
shown, where the entire effective geometric area at the sample plane
2
is 69 × 69 μm . Since the detector is sensitive to the entire mid-IR
bandwidth, the images represent integrated results over the entire
bandwidth accepted by the instrument. When the optics are aligned
and in focus, 12 distinct beams illuminate the area at the sample plane
side by side in a 3 × 4 arrangement, as expected due to the optical
(a) (b)
FIGURE 2.3 False color images [note color scale on (a)] of the illumination of
the FPA when the condenser is in focus (a) and out of focus (b) for the
transmission geometry at IRENI. The image that is in focus clearly illustrates
the 3 × 4 array of 12 individual beams. The beams have been spaced with an
approximate overlap such that when the condenser is slightly out of focus the
FPA is more homogeneously illuminated, which is the condition that is used for
the experiments described in the remainder of this section of the chapter.