
Page 100 - Whole Earth Geophysics An Introductory Textbook For Geologists And Geophysicists
P. 100
83
Sediments
Models
BS
20
by averaging
Water
80
|
ieee
Interpretation
rit
IS
thicknesses of an ophiolite, determined
km
70
a KEAAREP
:
:
:
; VS.
0.5
60
=45km
_h2=
:
Ngee.
oe
50
;
om
h,
_-Ve=2km/s
40
6.35 km
:
,
penmanns
of layer velocities and
1.5 km/s
30
HAR
Xcg™
=
20
T-Intercepts:
=
t= 7.738
eBIGg
t;=3.97s
$
V;
ts= 6.76
Model
10
a)
Water
4.9
0
FIGURE
results of seismic refraction to Introduction The Solid Earth: An studies of oceanic crust. Modified from 1990. b) Travel-time graph © Global Geophysics, by C. M. R. Fowler, forward _ computed (a). thicknesses in modeling of the velocities and refraction km/s 0.26 + 6.69 ~ 3 Layer from 0.24 km/s + 8.
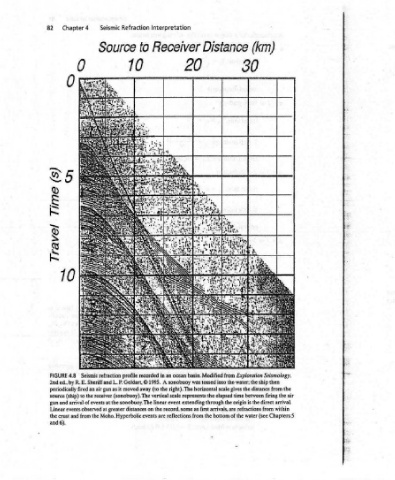
(km) 30 Exploration Seismology, the from the air firing is the direct arrival. refractions from within Chapters 5 water (see
Distance basin. Modified from A sonobuoy was tossed into the water; the ship then (to the right). The horizontal scale gives the distance the elapsed time between extending through the origin arrivals, are bottom of the
Interpretation Receiver 20 ocean an linear event the record, some as first reflections from the
Refraction to profile recorded in moved away The source (ship) to the receiver (sonobuoy). vertical scale represents
Seismic Source Seismic refraction 2nd ed.. by R. E. Sheriff and L. P. Geldart, © 1995. arrival of events at the sonobuoy. The Linear events observed at greater distances on from the Moho. Hyperbolic events are
Chapter4 oe) S 4.8 periodically fired an air gun as it and
(S) OUI], JEABLL — FIGURE and gun the crust and 6).
82