
Page 37 - Wire Bonding in Microelectronics
P. 37
16 Cha pte r T w o
0.400 T
Distance from tool tip (in) 0.240
0.320
0.160
0.080 3
1
0
60 40 20 0
Vibration amplitude (µ in)
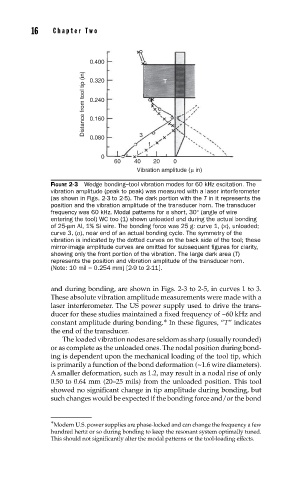
FIGURE 2-3 Wedge bonding–tool vibration modes for 60 kHz excitation. The
vibration amplitude (peak to peak) was measured with a laser interferometer
(as shown in Figs. 2-3 to 2-5). The dark portion with the T in it represents the
position and the vibration amplitude of the transducer horn. The transducer
frequency was 60 kHz. Modal patterns for a short, 30° (angle of wire
entering the tool) WC too (1) shown unloaded and during the actual bonding
of 25-µm Al, 1% Si wire. The bonding force was 25 g: curve 1, (×), unloaded;
curve 3, (o), near end of an actual bonding cycle. The symmetry of the
vibration is indicated by the dotted curves on the back side of the tool; these
mirror-image amplitude curves are omitted for subsequent fi gures for clarity,
showing only the front portion of the vibration. The large dark area (T)
represents the position and vibration amplitude of the transducer horn.
(Note: 10 mil = 0.254 mm) [2-9 to 2-11].
and during bonding, are shown in Figs. 2-3 to 2-5, in curves 1 to 3.
These absolute vibration amplitude measurements were made with a
laser interferometer. The US power supply used to drive the trans-
ducer for these studies maintained a fixed frequency of ~60 kHz and
constant amplitude during bonding. ∗ In these figures, “T” indicates
the end of the transducer.
The loaded vibration nodes are seldom as sharp (usually rounded)
or as complete as the unloaded ones. The nodal position during bond-
ing is dependent upon the mechanical loading of the tool tip, which
is primarily a function of the bond deformation (~1.6 wire diameters).
A smaller deformation, such as 1.2, may result in a nodal rise of only
0.50 to 0.64 mm (20–25 mils) from the unloaded position. This tool
showed no significant change in tip amplitude during bonding, but
such changes would be expected if the bonding force and/or the bond
∗ Modern U.S. power supplies are phase-locked and can change the frequency a few
hundred hertz or so during bonding to keep the resonant system optimally tuned.
This should not significantly alter the modal patterns or the tool-loading effects.