
Page 41 - Wire Bonding in Microelectronics
P. 41
20 Cha pte r T w o
7
T
6 5 0.24
Distance from tool tip (mm) 4 3 0.16 Distance from tool tip (in, approx.)
0.20
0.12
0.04
1 2 0.08
0 0
5 4 3 2 1 0
Vibration amplitude (relative values)
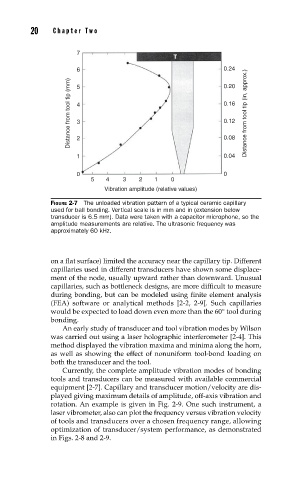
FIGURE 2-7 The unloaded vibration pattern of a typical ceramic capillary
used for ball bonding. Vertical scale is in mm and in (extension below
transducer is 6.5 mm). Data were taken with a capacitor microphone, so the
amplitude measurements are relative. The ultrasonic frequency was
approximately 60 kHz.
on a flat surface) limited the accuracy near the capillary tip. Different
capillaries used in different transducers have shown some displace-
ment of the node, usually upward rather than downward. Unusual
capillaries, such as bottleneck designs, are more difficult to measure
during bonding, but can be modeled using finite element analysis
(FEA) software or analytical methods [2-2, 2-9]. Such capillaries
would be expected to load down even more than the 60° tool during
bonding.
An early study of transducer and tool vibration modes by Wilson
was carried out using a laser holographic interferometer [2-4]. This
method displayed the vibration maxima and minima along the horn,
as well as showing the effect of nonuniform tool-bond loading on
both the transducer and the tool.
Currently, the complete amplitude vibration modes of bonding
tools and transducers can be measured with available commercial
equipment [2-7]. Capillary and transducer motion/velocity are dis-
played giving maximum details of amplitude, off-axis vibration and
rotation. An example is given in Fig. 2-9. One such instrument, a
laser vibrometer, also can plot the frequency versus vibration velocity
of tools and transducers over a chosen frequency range, allowing
optimization of transducer/system performance, as demonstrated
in Figs. 2-8 and 2-9.