
Page 42 - Wire Bonding in Microelectronics
P. 42
Ultrasonic Bonding Systems and Technologies 21
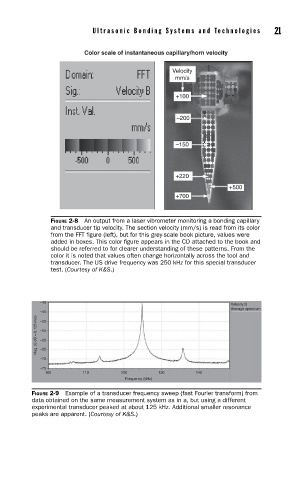
Color scale of instantaneous capillary/horn velocity
Velocity
mm/s
+100
–200
–150
+220
+500
+700
FIGURE 2-8 An output from a laser vibrometer monitoring a bonding capillary
and transducer tip velocity. The section velocity (mm/s) is read from its color
from the FFT fi gure (left), but for this grey-scale book picture, values were
added in boxes. This color fi gure appears in the CD attached to the book and
should be referred to for clearer understanding of these patterns. From the
color it is noted that values often change horizontally across the tool and
transducer. The US drive frequency was 250 kHz for this special transducer
test. (Courtesy of K&S.)
–40
Velocity B
Average spectrum
–45
Mag. (0 dB = 0.125 m/s) –55
–50
–60
–65
–70
–75
100 110 120 130 140
Frequency (kHz)
FIGURE 2-9 Example of a transducer frequency sweep (fast Fourier transform) from
data obtained on the same measurement system as in a, but using a different
experimental transducer peaked at about 125 kHz. Additional smaller resonance
peaks are apparent. (Courtesy of K&S.)