
Page 390 - Characterization and Properties of Petroleum Fractions - M.R. Riazi
P. 390
P2: IML/FFX
QC: IML/FFX
P1: IML/FFX
AT029-Manual-v7.cls
AT029-Manual
AT029-09
June 22, 2007
370 CHARACTERIZATION AND PROPERTIES OF PETROLEUM FRACTIONS
TABLE 9.2—Characterization parameters of the C 7+ fraction of sample of Table 9.1 [7].
SG
Pseudocomponent mol% T1: IML M 14:25 T b ,K n 20 N C P% N% A%
wt%
C 7+ (1) 10.0 12.5 110 0.750 391.8 1.419 8 58 22 20
C 7+ (2) 9.0 17.1 168 0.810 487.9 1.450 12.3 32 35 33
C 7+ (3) 7.7 23.1 263 0.862 602.1 1.478 19.3 17 37 46
C 7+ (4) 2.5 11.6 402 0.903 709.0 1.501 28.9 6 34 60
C 7+ (5) 1.2 8.2 608 0.949 777.6 1.538 44 0 45 55
30.4 72.5 209.8 0.843 576.7 1.469 15.3 25 34 41
Total C 7+
Experimental values on M 7+ and SG 7+ . Distribution parameters (for Eq. 4.56) and calculated values: M 7+ = 209.8; M o =
86.8; S o = 0.65; S 7+ = 0.844; B M = 1; A s = 0.119; n 7+ = 1.4698; A M = 1.417; B S = 3; M av = 209.8; S av = 0.847.
characterization parameters (i.e., M, T b , SG, n 20 , N C , and PNA ponent of heptane-plus, C 7 (1). The value of BIP of this pair
composition). This is done using the distribution model de- exhibits a major impact in the calculation results. K i values
scribed in Section 4.5.4 with M 7+ and SG 7+ as the input pa- are calculated from SRK EOS and flash calculations are per-
rameters. The basic parameters (T b , n 20 ) are calculated from formed for three stages shown in Fig. 9.3. The liquid product
--`,```,`,``````,`,````,```,,-`-`,,`,,`,`,,`---
the methods described in Chapter 2, while the PNA composi- from the first stage is used as the feed for the second stage
tion for each pseudocomponent is calculated from methods separator and flash calculation for this stage is performed
given in Section 3.5.1.2 (Eqs. 3.74–3.81). The calculation re- to calculate composition of feed for the last stage. Similarly,
sults with distribution parameters for Eq. (4.56) are given in the final crude oil is produced from the third stage at atmo-
spheric pressure. Composition of C 7+ in each stream can be
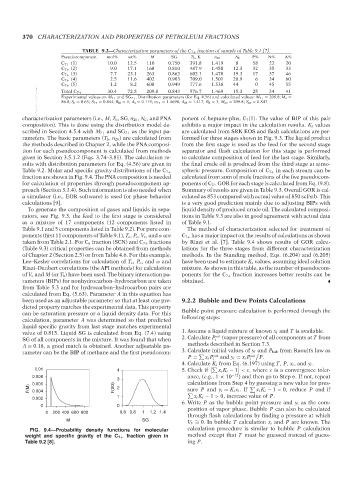
Table 9.2. Molar and specific gravity distributions of the C 7+
fraction are shown in Fig. 9.4. The PNA composition is needed calculated from sum of mole fractions of the five pseudocom-
for calculation of properties through pseudocomponent ap- ponents of C 7i . GOR for each stage is calculated from Eq. (9.8).
proach (Section 3.3.4). Such information is also needed when Summary of results are given in Table 9.3. Overall GOR is cal-
a simulator (i.e., EOR software) is used for phase behavior culated as 853 compared with actual value of 850 scf/stb. This
calculations [9]. is a very good prediction mainly due to adjusting BIPs with
To generate the composition of gases and liquids in sepa- liquid density of produced crude oil. The calculated composi-
rators, see Fig. 9.3, the feed to the first stage is considered tions in Table 9.3 are also in good agreement with actual data
as a mixture of 17 components (12 components listed in of Table 9.1.
Table 9.1 and 5 components listed in Table 9.2). For pure com- The method of characterization selected for treatment of
ponents (first 11 components of Table 9.1), T c , P c , V c , and ω are C 7+ has a major impact on the results of calculations as shown
taken from Table 2.1. For C 6 fraction (SCN) and C 7+ fractions by Riazi et al. [7]. Table 9.4 shows results of GOR calcu-
(Table 9.3) critical properties can be obtained from methods lations for the three stages from different characterization
of Chapter 2 (Section 2.5) or from Table 4.6. For this example, methods. In the Standing method, Eqs. (6.204) and (6.205)
Lee–Kesler correlations for calculation of T c , P c , and ω and have been used to estimate K i values, assuming ideal solution
Riazi–Daubert correlations (the API methods) for calculation mixture. As shown in this table, as the number of pseudocom-
of V c and M (or T b ) have been used. The binary interaction pa- ponents for the C 7+ fraction increases better results can be
rameters (BIPs) for nonhydrocarbon–hydrocarbon are taken obtained.
from Table 5.3 and for hydrocarbon–hydrocarbon pairs are
calculated from Eq. (5.63). Parameter A in this equation has
been used as an adjustable parameter so that at least one pre- 9.2.2 Bubble and Dew Points Calculations
dicted property matches the experimental data. This property
can be saturation pressure or a liquid density data. For this Bubble point pressure calculation is performed through the
calculation, parameter A was determined so that predicted following steps:
liquid specific gravity from last stage matches experimental
value of 0.815. Liquid SG is calculated from Eq. (7.4) using 1. Assume a liquid mixture of known x i and T is available.
sat
SG of all components in the mixture. It was found that when 2. Calculate P i (vapor pressure) of all components at T from
A = 0.18, a good match is obtained. Another adjustable pa- methods described in Section 7.3.
rameter can be the BIP of methane and the first pseudocom- 3. Calculate initial values of y i and P bub from Raoult’s law as
sat sat
P = x i P i and y i = x i P i P.
4. Calculate K i from Eq. (6.197) using T, P, x i , and y i .
0.01 4 5. Check if x i K i − 1 <ε, where ε is a convergence toler-
0.008 ance, (e.g., 1 × 10 −12 ) and then go to Step 6. If not, repeat
3
0.006 calculations from Step 4 by guessing a new value for pres-
F(M) 0.004 F(SG) 2 sure P and y i = K i x i .If x i K i − 1 < 0, reduce P and if
x i K i − 1 > 0, increase value of P.
0.002 1
6. Write P as the bubble point pressure and y i as the com-
0 0 position of vapor phase. Bubble P can also be calculated
0 200 400 600 800 0.6 0.8 1 1.2 1.4
through flash calculations by finding a pressure at which
M SG V F = 0. In bubble T calculation x i and P are known. The
∼
FIG. 9.4—Probability density functions for molecular calculation procedure is similar to bubble P calculation
weight and specific gravity of the C 7+ fraction given in method except that T must be guessed instead of guess-
Table 9.2 [8]. ing P.
Copyright ASTM International
Provided by IHS Markit under license with ASTM Licensee=International Dealers Demo/2222333001, User=Anggiansah, Erick
No reproduction or networking permitted without license from IHS Not for Resale, 08/26/2021 21:56:35 MDT