
Page 392 - Characterization and Properties of Petroleum Fractions - M.R. Riazi
P. 392
P2: IML/FFX
QC: IML/FFX
P1: IML/FFX
AT029-Manual-v7.cls
AT029-09
June 22, 2007
AT029-Manual
372 CHARACTERIZATION AND PROPERTIES OF PETROLEUM FRACTIONS
a. Thermodynamic model with use of SRK EOS similar to the
mixture critical properties [7].
one used in Example 9.1. T1: IML 14:25 TABLE 9.5—Effect of C 7+ characterization methods on calculated
b. Standing correlation, Eq. (9.9). Charac. Input for C 7+ No. of C 7+ T c ,K P c , bars
of Table 9.3
Fractions
scheme
Z c
c. Mahroun’s correlation, Eq. (9.10). Simulation 1 N C & T b 1 634 98 0.738
Simulation 2 N C & T b 5 651 141 0.831
Solution—(a) The saturation pressure of the reservoir fluid Calculations have been performed through PR EOS using a PVT simulator [9].
(Feed in Table 9.1) at 245 F can be calculated along flash cal-
◦
culations, using the method outlined above. Through flash
calculations (see Example 9.1) one can find a pressure at in Chapter 4, for lighter reservoir fluids such as gas conden-
245 F and that the amount of vapor produced is nearly zero sate samples detailed treatment of C 7+ has less effect on the
◦
(V F = 0). The pressure is equivalent to bubble (or saturation) phase equilibrium calculations of the fluid.
∼
pressure. This is a single-stage flash calculation that gives The true critical temperature (T tc ) of a defined mixture may
P sat = 2197 psia, which differs by −8% from the experimental also be calculated from the following simple mixing rule pro-
value of 2387 psia. (b) A simpler method is given by Eq. (9.9). posed by Li [11]:
This equation requires GOR, API oil , and SG gas . GOR is given T tc = φ i T ci
in Table 9.1 as 850 scf/stb. API oil is calculated from the specific (9.11) i
gravity of liquid from the third stage (SG = 0.815), which gives x i V ci
API oil = 42.12. SG gas is calculated from gas molecular weight, φ i = x i V ci
i
M gas , and definition of gas specific gravity by Eq. (2.6). Since where x i , T ci , and V ci are mole fraction, critical temperature,
gases are produced in three stages, M gas for these stages are and volume of component i in the mixture, respectively. The
calculated from the gas composition and molecular weights of average error for this method is about 0.6% (∼3 K) with max-
components as 23.92, 31.74, and 44.00, respectively. M gas for imum deviation of about 1.6% (∼8 K) [12]. The Kreglewski–
the whole gas produced from the feed may be calculated from
Kay correlation for calculation of true critical pressure, P tc ,
GOR of each stage as M gas = (601 × 23.92 + 142 × 31.74 +
is given as [13] follows:
107 × 44.00)/(601 + 142 + 107) = 27.76. SG gas = 27.76/29 =
0.957. From Eq. (9.9), A = 139.18 and P b = 2507.6 psia, which P tc = P pc 1 + (5.808 + 4.93ω)
T tc − 1
differs by +5.1% from the experimental value. (c) Using T pc
◦ (9.12)
Marhoun’s correlation (Eq. 9.10) with T = 705 R, SG oil = T pc = x i T ci P pc = and ω =
0.815, SG gas = 0.957, and GOR = 850 we get P b = 2292 psia i i x i P ci i x i ω i
(error of −4%). In this example, Marhoun’s correlation gives
the best result since it was mainly developed from PVT data where T pc and P pc are pseudocritical temperature and pres-
of oils from the Middle East. sure calculated through Kay’s mixing rule (Eq. 7.1). The aver-
age deviation for this method is reported as 3.8% (∼2 bar) for
nonmethane systems and average deviation of 50% (∼48 bar)
9.2.3 Generation of P–T Diagrams—True may be observed for methane–hydrocarbon systems [12].
Critical Properties These methods are recommended in the API-TDB [12] as well
as other sources [3].
A typical temperature–pressure (TP) diagram of a reservoir
fluid was shown in Fig. 5.3. The critical temperature and pres-
sure (critical point) in a PT diagram are true critical proper- 240
ties and not the pseudocritical. For pure substances, both the Bubble Point L : Liquid
true and pseudocritical properties are identical. The main ap- Dew Point V : Vapor
plication of a PT diagram is to determine the phase (liquid, 200 Critical Point L
vapor or solid) of a fluid mixture. For a mixture of known com-
--`,```,`,``````,`,````,```,,-`-`,,`,,`,`,,`---
position, pseudocritical temperature and pressure (T pc , P pc ) C7+ (5 components)
may be calculated from the Kay’s mixing rule (Eq. 7.1) or 160
other mixing rules presented in Chapter 5 (i.e., Table 5.17).
Methods of calculation of critical properties of undefined Pressure, bars 120
petroleum fractions presented in Section 2.5 all give pseudo- L L+V
critical properties. While pseudocritical properties are useful V
for generalized correlations and EOS calculations, they do not 80
represent the true critical point of a mixture, which indicates C7+ (1 component)
phase behavior of fluids. Calculated true critical temperature 40
and pressure for the reservoir fluid of Table 9.1 by simula-
tions 1 and 2 in Table 9.4 are given in Table 9.5. Generated PT
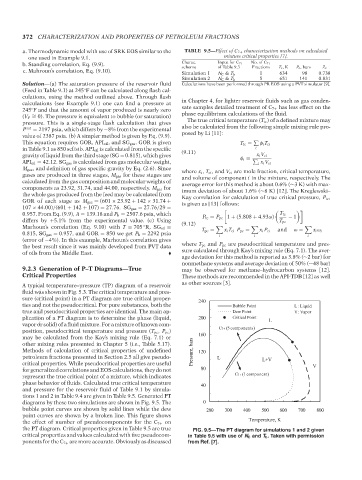
diagrams by these two simulations are shown in Fig. 9.5. The 0
bubble point curves are shown by solid lines while the dew 200 300 400 500 600 700 800
point curves are shown by a broken line. This figure shows
the effect of number of pseudocomponents for the C 7+ on Temperature, K
the PT diagram. Critical properties given in Table 9.5 are true FIG. 9.5—The PT diagram for simulations 1 and 2 given
critical properties and values calculated with five pseudocom- in Table 9.5 with use of N C and T b . Taken with permission
ponents for the C 7+ are more accurate. Obviously as discussed from Ref. [7].
Copyright ASTM International
Provided by IHS Markit under license with ASTM Licensee=International Dealers Demo/2222333001, User=Anggiansah, Erick
No reproduction or networking permitted without license from IHS Not for Resale, 08/26/2021 21:56:35 MDT