
Page 391 - Characterization and Properties of Petroleum Fractions - M.R. Riazi
P. 391
QC: IML/FFX
T1: IML
P2: IML/FFX
P1: IML/FFX
AT029-09
AT029-Manual-v7.cls
June 22, 2007
14:25
AT029-Manual
9. APPLICATIONS: PHASE EQUILIBRIUM CALCULATIONS 371
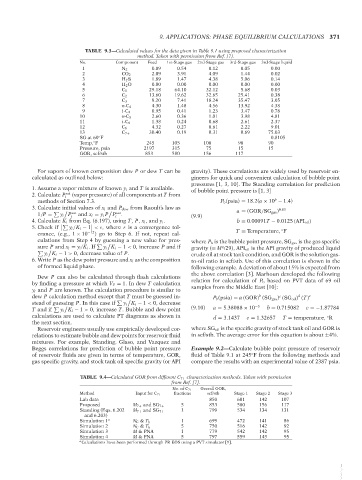
TABLE 9.3—Calculated values for the data given in Table 9.1 using proposed characterization
method. Taken with permission from Ref. [7].
No. Component Feed 1st-Stage gas 2nd-Stage gas 3rd-Stage gas 3rd-Stage liquid
1 N 2 0.09 0.54 0.12 0.05 0.00
2 CO 2 2.09 3.91 4.09 1.44 0.02
3 H 2 S 1.89 1.47 4.38 5.06 0.14
4 H 2 O 0.00 0.00 0.00 0.00 0.00
5 C 1 29.18 64.10 32.12 5.68 0.03
6 C 2 13.60 19.62 32.65 25.41 0.38
7 C 3 9.20 7.41 18.24 35.47 3.05
8 n-C 4 4.30 1.48 4.56 13.92 4.38
9 i-C 4 0.95 0.41 1.23 3.47 0.78
10 n-C 5 2.60 0.36 1.01 3.98 4.81
11 i-C 6 1.38 0.24 0.68 2.61 2.37
12 C 6 4.32 0.27 0.61 2.22 9.01
13 C 7+ 30.40 0.19 0.31 0.69 75.03
SG at 60 F 0.8105
◦
Temp, F 245 105 100 90 90
◦
Pressure, psia 2197 315 75 15 15
GOR, scf/stb 853 580 156 117
For vapors of known composition dew P or dew T can be gravity). These correlations are widely used by reservoir en-
calculated as outlined below: gineers for quick and convenient calculation of bubble point
pressures [1, 3, 10]. The Standing correlation for prediction
1. Assume a vapor mixture of known y i and T is available. of bubble point pressure is [1, 3]
2. Calculate P i sat (vapor pressure) of all components at T from
b
methods of Section 7.3. P b (psia) = 18.2(a × 10 − 1.4)
3. Calculate initial values of x i and P dew from Raoult’s law as 0.83
sat
sat a = (GOR/SG gas )
1/P = y i P and x i = y i P P .
i i (9.9)
4. Calculate K i from Eq. (6.197), using T, P, x i , and y i . b = 0.00091T − 0.0125 (API oil)
5. Check if y i /K i − 1 <ε, where ε is a convergence tol- ◦
erance, (e.g., 1 × 10 −12 ) go to Step 6. If not, repeat cal- T = Temperature, F
culations from Step 4 by guessing a new value for pres- where P b is the bubble point pressure, SG gas is the gas specific
y i K i − 1 < 0, increase P and if
sure P and x i = y i /K i .If
gravity (= M /29), API oil is the API gravity of produced liquid
g
y i K i − 1 > 0, decrease value of P. crude oil at stock tank condition, and GOR is the solution gas-
6. Write P as the dew point pressure and x i as the composition to-oil ratio in scf/stb. Use of this correlation is shown in the
of formed liquid phase. following example. A deviation of about 15% is expected from
the above correlation [3]. Marhoun developed the following
Dew P can also be calculated through flash calculations
by finding a pressure at which V F = 1. In dew T calculation relation for calculation of P b based on PVT data of 69 oil
y i and P are known. The calculation procedure is similar to samples from the Middle East [10]:
dew P calculation method except that T must be guessed in- P b (psia) = a (GOR) (SG gas ) (SG oil) (T) e
d
b
c
y i K i − 1 < 0, decrease
stead of guessing P. In this case if
y i K i − 1 > 0, increase T. Bubble and dew point
T and if
(9.10) a = 5.38088 × 10 −3 b = 0.715082 c =−1.87784
calculations are used to calculate PT diagrams as shown in d = 3.1437 e = 1.32657 T = temperature, R
◦
the next section.
Reservoir engineers usually use empirically developed cor- where SG oil is the specific gravity of stock tank oil and GOR is
relations to estimate bubble and dew points for reservoir fluid in scf/stb. The average error for this equation is about ±4%.
mixtures. For example, Standing, Glaso, and Vazquez and
Beggs correlations for prediction of bubble point pressure Example 9.2—Calculate bubble point pressure of reservoir
of reservoir fluids are given in terms of temperature, GOR, fluid of Table 9.1 at 245 F from the following methods and
◦
gas specific gravity, and stock tank oil specific gravity (or API compare the results with an experimental value of 2387 psia.
TABLE 9.4—Calculated GOR from different C 7+ characterization methods. Taken with permission
from Ref. [7].
Overall GOR,
No. of C 7+
Method Input for C 7+ fractions scf/stb Stage 1 Stage 2 Stage 3
Lab data 850 601 142 107
Proposed M 7+ and SG 7+ 5 853 580 156 117
Standing (Eqs. 6.202 M 7+ and SG 7+ 1 799 534 134 131
and 6.203)
Simulation 1 a N C & T b 1 699 472 141 86
Simulation 2 N C & T b 5 750 516 142 92
Simulation 3 M & PNA 1 779 542 142 95
Simulation 4 M & PNA 5 797 559 143 95
a Calculations have been performed through PR EOS using a PVT simulator [9].
--`,```,`,``````,`,````,```,,-`-`,,`,,`,`,,`---
Copyright ASTM International
Provided by IHS Markit under license with ASTM Licensee=International Dealers Demo/2222333001, User=Anggiansah, Erick
No reproduction or networking permitted without license from IHS Not for Resale, 08/26/2021 21:56:35 MDT