
Page 1074 - Advanced Organic Chemistry Part A - Structure and Mechanisms, 5th ed (2007) - Carey _ Sundberg
P. 1074
1058 0.8 1 1.2 1.4 1.6 1.8
70
CHAPTER 11 E a 60 60 E a
E
Free Radical Reactions a
50 E a
40 40
30 Potential energy (kJ mol 1 ) Potential energy (kJ mol 1 ) 20
20
10 0 d (CH 4 CH 3 )
S
d S 0 l CH S
l d (CH 4 C 2 H 6 )
CH B C
–10 –20
0.8 1 1.2 1.4 1.6 1.8
.
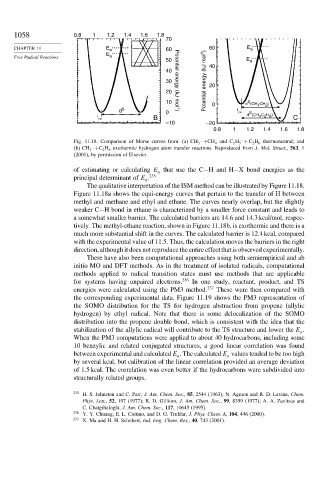
Fig. 11.18. Comparison of Morse curves from: (a) CH 3 ·+CH 4 and C 2 H 5 + C 2 H 6 thermoneutral; and
(b) CH 3 ·+C 2 H 6 exothermic hydrogen atom transfer reactions. Reproduced from J. Mol. Struct., 563,1
(2001), by permission of Elsevier.
of estimating or calculating E that use the C−H and H−X bond energies as the
a
principal determinant of E . 235
a
The qualitative interpretation of the ISM method can be illustrated by Figure 11.18.
Figure 11.18a shows the equi-energy curves that pertain to the transfer of H between
methyl and methane and ethyl and ethane. The curves nearly overlap, but the slightly
weaker C−H bond in ethane is characterized by a smaller force constant and leads to
a somewhat smaller barrier. The calculated barriers are 14.6 and 14.3 kcal/mol, respec-
tively. The methyl-ethane reaction, shown in Figure 11.18b, is exothermic and there is a
much more substantial shift in the curves. The calculated barrier is 12.4 kcal, compared
with the experimental value of 11.5. Thus, the calculation moves the barriers in the right
direction, although it does not reproduce the entire effect that is observed experimentally.
There have also been computational approaches using both semiempirical and ab
initio MO and DFT methods. As in the treatment of isolated radicals, computational
methods applied to radical transition states must use methods that are applicable
for systems having unpaired electrons. 236 In one study, reactant, product, and TS
energies were calculated using the PM3 method. 237 These were then compared with
the corresponding experimental data. Figure 11.19 shows the PM3 representation of
the SOMO distribution for the TS for hydrogen abstraction from propene (allylic
hydrogen) by ethyl radical. Note that there is some delocalization of the SOMO
distribution into the propene double bond, which is consistent with the idea that the
stabilization of the allylic radical will contribute to the TS structure and lower the E
a
When the PM3 computations were applied to about 40 hydrocarbons, including some
10 benzylic and related conjugated structures, a good linear correlation was found
between experimental and calculated E . The calculated E values tended to be too high
a
a
by several kcal, but calibration of the linear correlation provided an average deviation
of 1.5 kcal. The correlation was even better if the hydrocarbons were subdivided into
structurally related groups.
235
H. S. Johnston and C. Parr, J. Am. Chem. Soc., 85, 2544 (1963); N. Agmon and R. D. Levine, Chem.
Phys. Lett., 52, 197 (1977); R. D. Gilliom, J. Am. Chem. Soc., 99, 8399 (1977); A. A. Zavitsas and
C. Chatgilialoglu, J. Am. Chem. Soc., 117, 10645 (1995).
236 Y. Y. Chuang, E. L. Coitino, and D. G. Truhlar, J. Phys. Chem. A, 104, 446 (2000).
237
X. Ma and H. H. Schobert, Ind. Eng. Chem. Res., 40, 743 (2001).