Page 377 - Advanced Organic Chemistry Part A - Structure and Mechanisms, 5th ed (2007) - Carey _ Sundberg
P. 377

358                                Table 3.31. Wavelength and Energy Shift in
                                          N-Methylacridone-Lewis Acid Complexes
     CHAPTER 3
                                         Lewis acid       max (nm)    h  fl (eV)
     Structural Effects on
     Stability and Reactivity
                                        Fe ClO 4   3      478          2 59
                                                          474          2 62
                                        Sc O 3 SCF 3   3
                                                          471          2 63
                                        Fe ClO 4   2
                                                          471          2 63
                                        Cu ClO 4   2
                                                          460          2 70
                                        Yb O 3 SCF 3   3
                                                          458          2 71
                                        La O 3 SCF 3   3
                                                          456          2 72
                                        Zn O 3 SCF 3   3
                                        Ph 3 SnCl         455          2 72
                                                          453          2 72
                                        Bu 2 SnCl 2
                                                          451          2 75
                                        Mg ClO 4   2
                                                          442          2 81
                                        LiClO 4
                                                          437          2 84
                                        NaClO 4
                                        Uncomplexed       432          2 87
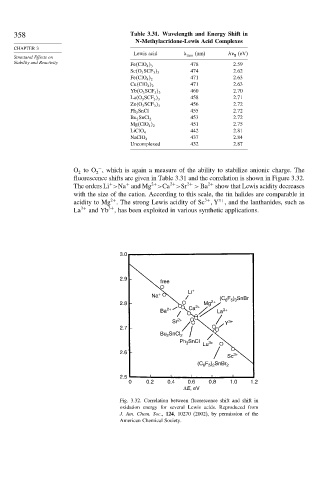
                       O to O , which is again a measure of the ability to stabilize anionic charge. The
                               −
                         2    2
                       fluorescence shifts are given in Table 3.31 and the correlation is shown in Figure 3.32.
                                       +
                                                    2+
                                              2+
                                  +
                       The orders Li >Na and Mg >Ca >Sr  2+  > Ba 2+  show that Lewis acidity decreases
                       with the size of the cation. According to this scale, the tin halides are comparable in
                                  2+
                                                              3+
                       acidity to Mg . The strong Lewis acidity of Sc  Y , and the lanthanides, such as
                                                                   3+
                                  3+
                       La 3+  and Yb , has been exploited in various synthetic applications.
                                     3.0
                                     2.9
                                                 free
                                                         Li +
                                               Na +                (C F ) SnBr
                                     2.8                    2+  Mg 2+  6 5 3
                                                 Ba 2+    Ca      La 3+
                                                     Sr 2+           Y 3+
                                     2.7
                                                 Bu SnCl 2
                                                   2
                                                       Ph SnCl  Lu 3+
                                                         3
                                     2.6                               3+
                                                                     Sc
                                                               F ) SnBr
                                                            (C 6 5 2  2
                                     2.5
                                        0    0.2   0.4   0.6    0.8   1.0   1.2
                                                        ΔE, eV

                                     Fig. 3.32. Correlation between fluorescence shift and shift in
                                     oxidation energy for several Lewis acids. Reproduced from
                                     J. Am. Chem. Soc., 124, 10270 (2002), by permission of the
                                     American Chemical Society.
   372   373   374   375   376   377   378   379   380   381   382