
Page 17 - Advances in Biomechanics and Tissue Regeneration
P. 17
1.4 PATIENT-SPECIFIC MATERIAL BEHAVIOR 11
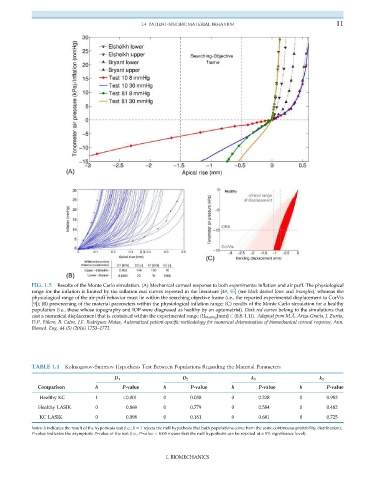
FIG. 1.5 Results of the Monte Carlo simulation. (A) Mechanical corneal response to both experiments: inflation and air puff. The physiological
range for the inflation is limited by the inflation real curves reported in the literature [48, 55] (see black dashed lines and triangles), whereas the
physiological range of the air-puff behavior must lie within the searching objective frame (i.e., the reported experimental displacement to CorVis
[9]); (B) prescreening of the material parameters within the physiological inflation range; (C) results of the Monte Carlo simulation for a healthy
population (i.e., those whose topography and IOP were diagnosed as healthy by an optometrist). Dark red curves belong to the simulations that
cast a numerical displacement that is contained within the experimental range (U Healthy [mm] 2 (0.8, 1.1)). Adapted from M.Á. Ariza-Gracia, J. Zurita,
D.P. Piñero, B. Calvo, J.F. Rodríguez Matas, Automatized patient-specific methodology for numerical determination of biomechanical corneal response, Ann.
Biomed. Eng. 44 (5) (2016) 1753–1772.
TABLE 1.1 Kolmogorov-Smirnov Hypothesis Test Between Populations Regarding the Material Parameters
D 1 D 2 k 1 k 2
Comparison h P-value h P-value h P-value h P-value
Healthy KC 1 <0.001 0 0.058 0 0.328 0 0.983
Healthy LASIK 0 0.869 0 0.779 0 0.584 0 0.482
KC LASIK 0 0.098 0 0.161 0 0.681 0 0.725
Notes: h indicates the result of the hypothesis test (i.e., h ¼ 1 rejects the null hypothesis that both populations come from the same continuous probability distribution);
P-value indicates the asymptotic P-value of the test (i.e., P-value < 0.05 means that the null hypothesis can be rejected at a 5% significance level).
I. BIOMECHANICS