
Page 18 - Advances in Biomechanics and Tissue Regeneration
P. 18
12 1. PERSONALIZED CORNEAL BIOMECHANICS
TABLE 1.2 Kolmogorov-Smirnov Hypothesis Test Between Populations Regarding the Stress-Strain Apical Behavior
Anterior Posterior
Stretch Stress Stretch Stress
Comparison h P-value h P-value h P-value h P-value
Healthy KC 1 <0.001 1 <0.001 1 <0.001 1 <0.001
Healthy LASIK 1 <0.001 0 0.073 1 <0.001 1 <0.001
KC LASIK 1 <0.001 0 0.083 1 <0.001 1 0.049
Notes: h indicates the result of the hypothesis test (i.e., h ¼ 1 rejects the null hypothesis that both populations come from the same continuous probability distribution);
P-value indicates asymptotic P-value of the test (i.e., P-value < 0.05 means that the null hypothesis can be rejected at a 5% significance level).
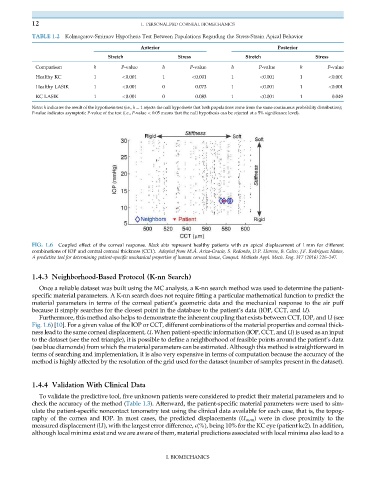
FIG. 1.6 Coupled effect of the corneal response. Black dots represent healthy patients with an apical displacement of 1 mm for different
combinations of IOP and central corneal thickness (CCT). Adapted from M.Á. Ariza-Gracia, S. Redondo, D.P. Llorens, B. Calvo, J.F. Rodríguez Matas,
A predictive tool for determining patient-specific mechanical properties of human corneal tissue, Comput. Methods Appl. Mech. Eng. 317 (2016) 226–247.
1.4.3 Neighborhood-Based Protocol (K-nn Search)
Once a reliable dataset was built using the MC analysis, a K-nn search method was used to determine the patient-
specific material parameters. A K-nn search does not require fitting a particular mathematical function to predict the
material parameters in terms of the corneal patient’s geometric data and the mechanical response to the air puff
because it simply searches for the closest point in the database to the patient’s data (IOP, CCT, and U).
Furthermore, this method also helps to demonstrate the inherent coupling that exists between CCT, IOP, and U (see
Fig. 1.6)[10]. For a given value of the IOP or CCT, different combinations of the material properties and corneal thick-
ness lead to the same corneal displacement, U. When patient-specific information (IOP, CCT, and U) is used as an input
to the dataset (see the red triangle), it is possible to define a neighborhood of feasible points around the patient’s data
(see blue diamonds) from which the material parameters can be estimated. Although this method is straightforward in
terms of searching and implementation, it is also very expensive in terms of computation because the accuracy of the
method is highly affected by the resolution of the grid used for the dataset (number of samples present in the dataset).
1.4.4 Validation With Clinical Data
To validate the predictive tool, five unknown patients were considered to predict their material parameters and to
check the accuracy of the method (Table 1.3). Afterward, the patient-specific material parameters were used to sim-
ulate the patient-specific noncontact tonometry test using the clinical data available for each case, that is, the topog-
raphy of the cornea and IOP. In most cases, the predicted displacements (U num ) were in close proximity to the
measured displacement (U), with the largest error difference, E(%), being 10% for the KC eye (patient kc2). In addition,
although local minima exist and we are aware of them, material predictions associated with local minima also lead to a
I. BIOMECHANICS