
Page 92 - Advances in Biomechanics and Tissue Regeneration
P. 92
5.3 RESULTS 87
the stress-free configuration was not known and the medical images in all the presented cases were given at a specific
time instant, a ramp was used for reaching the diastolic pressure that was finally used as a starting configuration of the
cardiac cycle. As discussed in Section 5.2.2, the simulations were carried out using a 16-node, Dual Nehalem (64 bits),
16-processor cluster with a clock speed of 2.33 GHz and 32 GB of memory for each node. Convergence was considered
4
reached when the residuals of error for momentum and continuity fell below 10 .
5.3 RESULTS
5.3.1 Arterial Hemodynamics
The hemodynamic characteristics of the considered human arteries are determined by the arterial morphologies
that imply changes in vessel curvature, diameter, and tortuosity. Especially, bifurcation regions are predisposed to
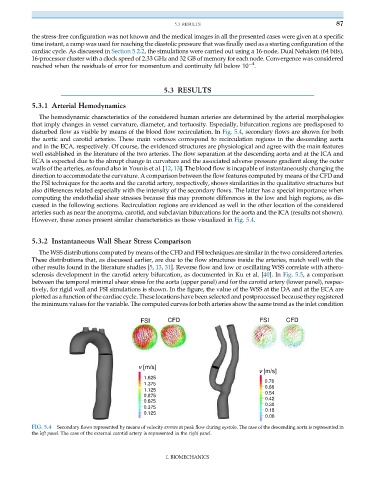
disturbed flow as visible by means of the blood flow recirculation. In Fig. 5.4, secondary flows are shown for both
the aortic and carotid arteries. These main vortexes correspond to recirculation regions in the descending aorta
and in the ECA, respectively. Of course, the evidenced structures are physiological and agree with the main features
well established in the literature of the two arteries. The flow separation at the descending aorta and at the ICA and
ECA is expected due to the abrupt change in curvature and the associated adverse pressure gradient along the outer
walls of the arteries, as found also in Younis et al. [12, 13]. The blood flow is incapable of instantaneously changing the
direction to accommodate the curvature. A comparison between the flow features computed by means of the CFD and
the FSI techniques for the aorta and the carotid artery, respectively, shows similarities in the qualitative structures but
also differences related especially with the intensity of the secondary flows. The latter has a special importance when
computing the endothelial shear stresses because this may promote differences in the low and high regions, as dis-
cussed in the following sections. Recirculation regions are evidenced as well in the other location of the considered
arteries such as near the anonyma, carotid, and subclavian bifurcations for the aorta and the ICA (results not shown).
However, these zones present similar characteristics as those visualized in Fig. 5.4.
5.3.2 Instantaneous Wall Shear Stress Comparison
The WSS distributions computed by means of the CFD and FSI techniques are similar in the two considered arteries.
These distributions that, as discussed earlier, are due to the flow structures inside the arteries, match well with the
other results found in the literature studies [5, 13, 31]. Reverse flow and low or oscillating WSS correlate with athero-
sclerosis development in the carotid artery bifurcation, as documented in Ku et al. [40]. In Fig. 5.5, a comparison
between the temporal minimal shear stress for the aorta (upper panel) and for the carotid artery (lower panel), respec-
tively, for rigid wall and FSI simulations is shown. In the figure, the value of the WSS at the DA and at the ECA are
plotted as a function of the cardiac cycle. These locations have been selected and postprocessed because they registered
the minimum values for the variable. The computed curves for both arteries show the same trend as the inlet condition
FSI CFD FSI CFD
v [m/s]
v [m/s]
1.625
0.78
1.375 0.66
1.125
0.875 0.54
0.625 0.42
0.30
0.375
0.125 0.18
0.06
FIG. 5.4 Secondary flows represented by means of velocity arrows at peak flow during systole. The case of the descending aorta is represented in
the left panel. The case of the external carotid artery is represented in the right panel.
I. BIOMECHANICS